
Have you ever wondered where your Shopify customers spend most of their time on your website? Or why some products get clicks while others get almost no attention at all? If you’ve ever felt like you’re missing a secret window into your customers’ minds, heatmaps might be exactly what you need. By the time you finish reading this article, you will understand how heatmaps work, the different types available for Shopify, and how they can transform your sales strategy. Ready to discover these colorful insights? Let’s begin!
In this section, you’ll learn what heatmaps are and why they’re so important. We’ll look at the history of analyzing online behavior and see how heatmaps can give you a unique, visual perspective on your Shopify store. Keep reading to find out how heatmaps can fill the gap between raw numbers and real customer behavior!
Definition and Importance of Heatmaps in Ecommerce Analytics
A heatmap is a visual representation of user interactions on a webpage. Colors show you where customers click, scroll, or hover the most. They’re important in ecommerce because they turn complex data into easy-to-read visuals, helping you quickly see what’s working and what isn’t.
Evolution of User Behavior Analysis in Online Shopping
Years ago, analytics focused mainly on pageviews and bounce rates. While these metrics are useful, they can’t always explain why visitors behave a certain way. Heatmaps add an extra layer of insight by showing exactly how users interact with each part of your store.
The Unique Challenges of Understanding Customer Behavior in Shopify Stores
Shopify sites often have multiple product pages, collections, and promotions. It can be hard to know where customers get stuck or what they might ignore. Heatmaps give you a roadmap of clicks, scrolls, and hovers so you can spot pain points quickly.
How Heatmaps Bridge the Gap Between Traditional Analytics and Actionable Insights
Tools like Google Analytics can tell you how many people visited your site or how long they stayed. But a heatmap tells you where they clicked, how far they scrolled, and which elements they ignored. It transforms raw stats into real behavior patterns you can act on.
The Role of Visual Data Representation in Conversion Optimization
Colorful zones of red and orange indicate high engagement, while cooler blues show areas users rarely visit. This clear visual format makes it easy to see what needs improvement.
Overview of Heatmap Applications Specifically in the Shopify Ecosystem
Many heatmap tools integrate seamlessly with Shopify, letting you track user clicks on product images, collections, and even the checkout page. These insights can lead to improved layouts, better calls to action, and higher sales.
Great start! Now you know why heatmaps matter. Next, let’s dig deeper into how heatmap technology actually works in ecommerce.
Understanding Heatmap Technology in Ecommerce
In this section, we’ll explore the science behind heatmaps and how they evolved for online stores. You’ll learn how integration with other analytics tools works, and why privacy matters. At the end, you’ll see how real-time vs. aggregated data can impact your decisions. Ready for a tech dive?
Fundamental Principles of Heatmap Visualization
Heatmaps convert user activity into color gradients. The more activity an area gets, the warmer the color. This visual approach makes it easy to spot trends without sifting through complicated tables.
The Science Behind Color-Coded User Interaction Data
Red, orange, and yellow often represent high engagement, while green and blue signal lower interaction. These colors are chosen because they stand out clearly and align with how people interpret intensity.
Evolution of Heatmap Technology for Digital Environments
Heatmaps originally were used in fields like geography and meteorology. Today, web-focused heatmap tools capture clicks, scroll depth, and cursor movement in real time, offering instant insights into user behavior.
Differences Between Heatmaps for Physical Retail and Online Stores
Physical stores rely on customer flow analysis, but online heatmaps let you see every click and scroll. This level of detail can’t be matched in a brick-and-mortar setting.
Integration Capabilities with Other Analytics Tools
Many heatmap tools connect directly with Google Analytics, allowing you to match heatmap findings with metrics like bounce rate or traffic source. This combined approach offers a complete picture of how visitors behave.
Real-Time vs. Aggregated Heatmap Data Collection
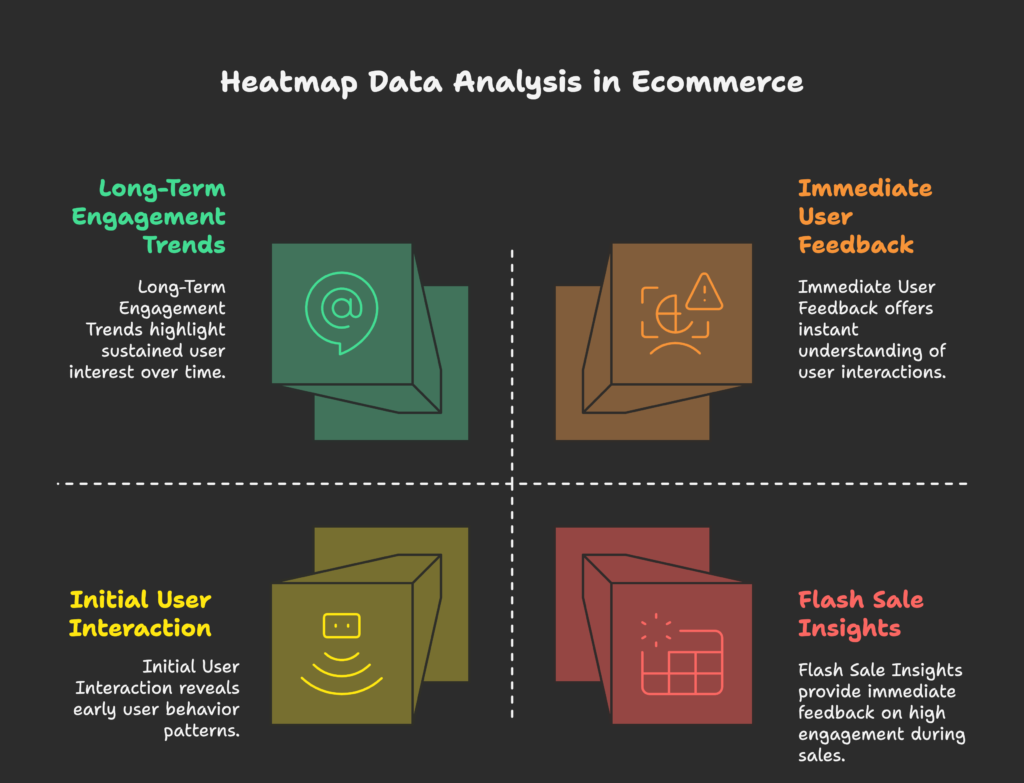
Real-time heatmaps show immediate user behavior, which can be helpful during high-traffic events like flash sales. Aggregated data, on the other hand, reveals patterns over time for more stable insights.
Privacy Considerations and Compliance in User Behavior Tracking
Always disclose tracking methods in your privacy policy. Make sure to comply with laws like GDPR or CCPA, and avoid collecting personal information without consent.
You’ve now seen how heatmap tools gather data and present it visually. Next up, we’ll explore the different heatmap types that Shopify merchants can use.
Types of Heatmaps for Shopify Stores
In this section, you’ll discover various heatmap formats—from click maps to scroll maps—each offering unique insights. By the end, you’ll have a toolkit of heatmap options to address different questions about user behavior. Excited to find the perfect heatmap for your store?
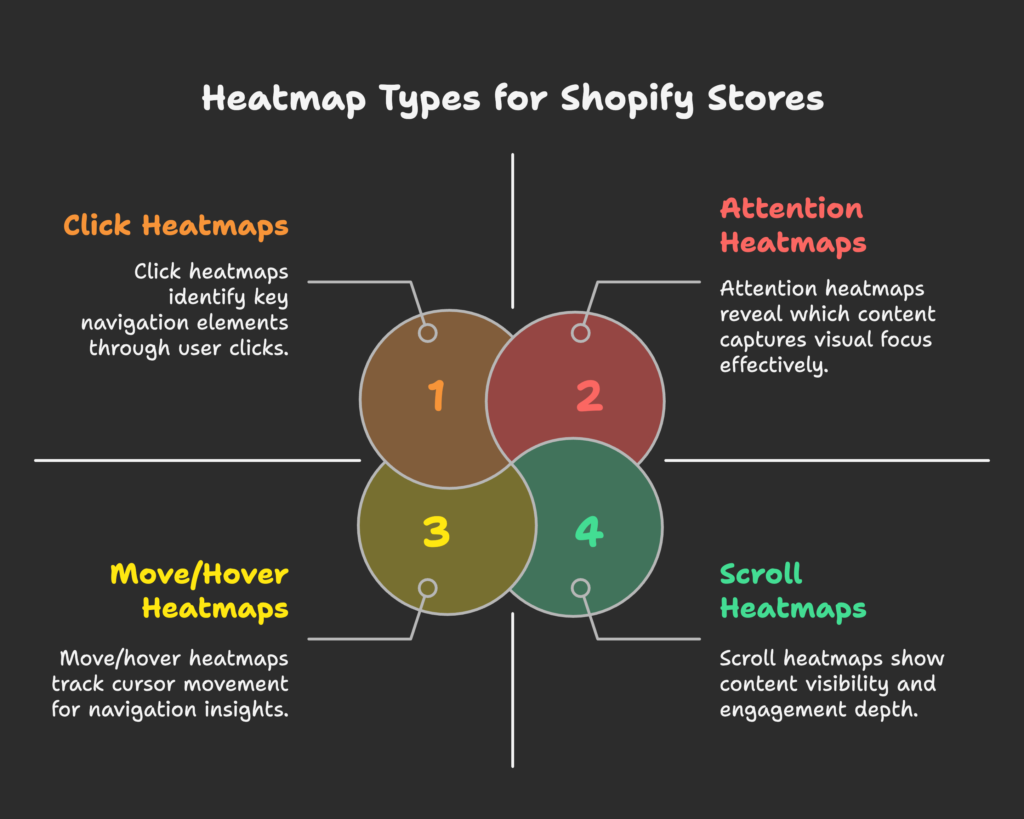
Click Heatmaps: Tracking Where Users Engage Most
Click heatmaps show precisely which buttons, links, or images get the most clicks. This helps you identify which parts of your page are truly “click magnets.”
Scroll Heatmaps: Understanding Content Visibility and Engagement
Scroll heatmaps reveal how far down the page most visitors read. If crucial information is below the average scroll depth, you might need to move it up.
Move/Hover Heatmaps: Analyzing Cursor Movement Patterns
These maps track where users move their cursors, which can sometimes indicate eye movement. It’s useful for seeing which elements draw attention, even if they’re not clicked.
Attention Heatmaps: Identifying Visual Focus Areas
Attention heatmaps combine scroll depth and time on page to show which sections get the most “staring time.” It’s ideal for analyzing how effectively your headlines or images capture attention.
Form Analytics Heatmaps: Optimizing Checkout and Signup Flows
This type focuses on user interactions with forms. See where people hesitate, abandon fields, or make errors. Perfect for streamlining checkout or registration processes.
Mobile-Specific Heatmaps: Adapting Analysis for Touch Interfaces
Mobile users tap and scroll differently than desktop users. Mobile-friendly heatmaps help you catch issues like small tap targets or confusing layouts on phones and tablets.
Session Recordings: Complementary Visual Analysis Alongside Heatmaps
Though not exactly a heatmap, session recordings show user journeys in real time, which can clarify the “why” behind certain heatmap hotspots.
You’ve learned about many heatmap varieties. Next, let’s see why it’s worth the investment for your Shopify store.
The Business Case for Implementing Heatmaps
In this section, you’ll find out how heatmaps can boost your ROI, improve conversion rates, and cut cart abandonment. By the end, you’ll understand the real-world benefits of using heatmaps for your business. Ready to see how colorful data can increase your revenue?
ROI of Heatmap Implementation for Shopify Merchants
By spotting areas of confusion, you can fix issues faster, boosting user satisfaction and sales. Spending on heatmap tools often pays for itself when you uncover profitable changes.
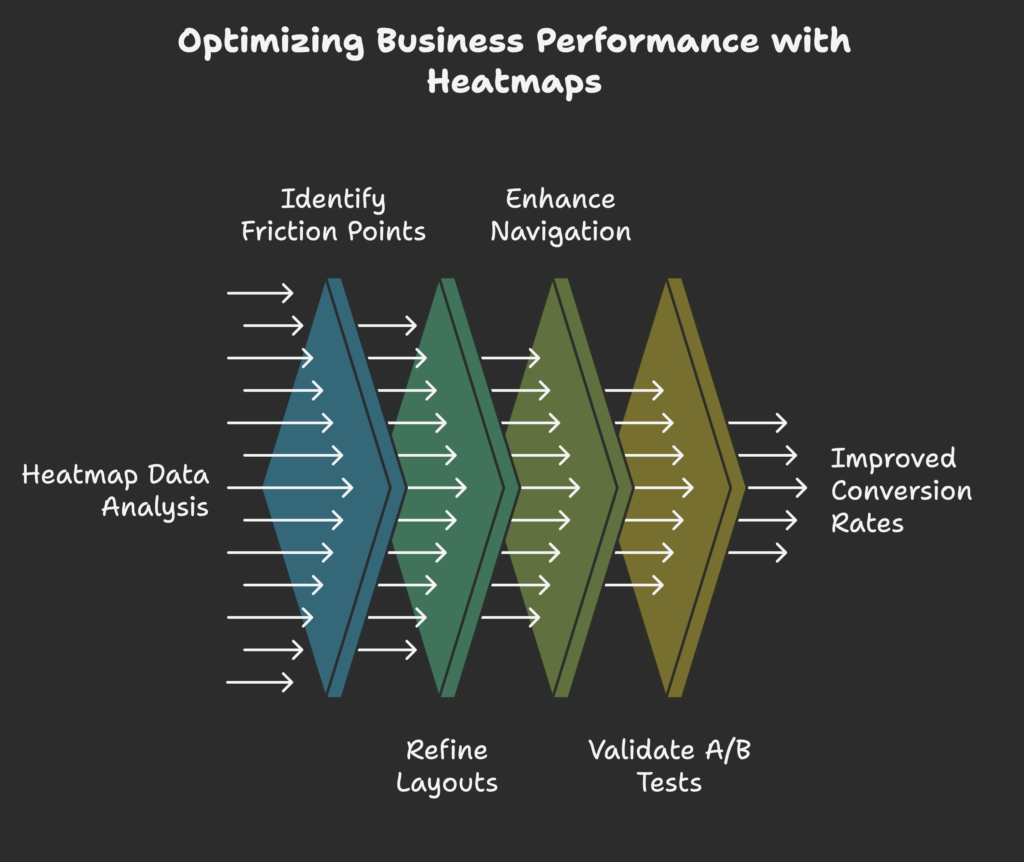
Conversion Rate Optimization Potential Through Behavior Insights
Heatmaps let you see which page elements get ignored or misused, guiding you to refine layouts and promotions. Small tweaks can yield big improvements in conversion.
Reducing Cart Abandonment Through Friction Point Identification
Heatmaps can show where customers hesitate or attempt to click something that doesn’t respond. That’s a clue to streamline the checkout experience.
Improving Product Page Effectiveness with Visual Feedback
Learn if your product photos are getting enough attention, or if your “Add to Cart” button is too far down the page. Then rearrange items to boost sales.
Enhancing Navigation and Site Architecture Based on User Patterns
When a high-traffic link is buried in your menu, you might consider promoting it more prominently. Heatmaps make these insights crystal clear.
A/B Testing Validation Through Heatmap Analysis
Testing two page versions? Heatmaps help verify which layout, headline, or call-to-action is truly better, giving you visual evidence to back up numeric metrics.
Customer Journey Optimization Across Multiple Touchpoints
By analyzing different pages, you can spot where users drop off or struggle. This 360-degree view helps you create a smoother shopping journey.
Now that you understand the payoff, let’s explore which user behaviors you should focus on in your analysis.
Identifying Critical User Behavior Patterns
In this section, you’ll learn how to read cursor movements for clues about purchase intent, see how seasonality affects scrolling, and more. By the end, you’ll know which patterns to watch out for the most. Ready to decode your customers’ next moves?
Understanding Purchase Intent Signals in Cursor Movements
Repeated hovering around a product image or the “Add to Cart” button might signal high purchase intent. Use these patterns to refine your calls to action.
Recognizing Hesitation Patterns in the Checkout Process
Hesitation or frantic cursor movement can mean confusion or anxiety. This clue can help you clarify shipping details or simplify payment methods.
Mapping Shopping Pattern Differences Across Device Types
Desktop, mobile, and tablet users behave differently. Heatmaps help you adapt your site design to each device type’s needs and habits.
Analyzing Seasonal and Promotional Impact on Browsing Behavior
During holidays or sales, user behavior changes. Heatmaps reveal whether visitors react well to new banners or if they skip straight to discount pages.
Identifying Content Engagement Gaps Through Scroll Analysis
If visitors rarely scroll past a certain point, you may need to move key information higher or shorten the page for better engagement.
Detecting Navigation Confusion and Roadblocks
Lots of erratic clicking on menu items might indicate a lack of clarity in your navigation. Streamline your categories and labeling for a smoother flow.
Correlating Heatmap Data with Conversion Metrics
Match heatmap hotspots with sales data to see if popular clicked areas lead to actual purchases. This ensures you focus on changes that impact revenue.
Now that you know what behaviors to look for, let’s dive into how to install heatmaps on your Shopify store.
Implementing Heatmaps on Your Shopify Store
In this section, you’ll discover the technical steps to get heatmaps running. We’ll cover setup, data collection, and privacy compliance, leaving you ready to roll out a heatmap tool confidently. Ready to turn your store into a behavior-tracking machine?
Technical Prerequisites for Heatmap Tool Integration
You’ll need access to your Shopify admin panel and sometimes a snippet of code to paste into your theme. Most apps guide you through this process.
Installation and Setup Process for Heatmap Apps
Simply find a heatmap app in the Shopify App Store, install it, and follow the prompts to connect it with your store. Each tool has its own tutorial, but it’s usually quick and straightforward.
Configuring Data Collection Parameters and Sampling
Choose which pages to track and set how many visitor sessions you want to record. You can focus on high-traffic pages first to get faster insights.
Ensuring Proper Tracking Across Responsive Designs
If your site is mobile-responsive, confirm your heatmap tool can handle different device layouts without losing data.
Performance Considerations and Site Speed Impact
Most modern heatmap scripts are optimized for performance, but keep an eye on load times to ensure customers aren’t affected.
Setting Up User Segments for Targeted Analysis
You can filter data by customer type (new vs. returning), location, or traffic source to see how different segments behave.
Compliance with Privacy Regulations and Cookie Policies
Make sure your customers know about tracking. Show a cookie banner or update your privacy policy to reflect data collection practices.
Implementation is doable! Next, we’ll explore the best heatmap tools to consider for Shopify.
Top Heatmap Tools for Shopify
In this section, you’ll learn about the leading heatmap apps—Lucky Orange, Hotjar, Crazy Egg, Microsoft Clarity, and more. By the end, you’ll have a clear idea of which tool fits your store’s size and needs. Ready to pick your perfect heatmap partner?
Lucky Orange: Features, Pricing, and Integration Capabilities
Lucky Orange offers click heatmaps, session recordings, and a live chat feature. It integrates smoothly with Shopify and has scalable pricing plans for different store sizes.
Hotjar: Comprehensive Behavior Analytics Suite
Hotjar is known for its user-friendly dashboard, offering heatmaps, recordings, and feedback polls. It’s popular for its all-in-one approach to user behavior insights.
Crazy Egg: Visualization Strengths and Limitations
Crazy Egg focuses on visual reports like “Confetti” and “Overlay,” which break down clicks by source. While it lacks some advanced analytics, it excels in easy-to-read charts.
Microsoft Clarity: Free Heatmap Solution for Shopify
Clarity is a free tool by Microsoft, offering heatmaps and session recordings. It’s budget-friendly and integrates quickly, though it may have fewer premium features than paid solutions.
HeatMap by Webyze: Shopify-Specific Implementation
Designed just for Shopify users, this app offers real-time heatmaps with straightforward installation. Ideal for store owners who want a plug-and-play solution.
Comparative Analysis of Features Across Platforms
Look for session recording length, reporting detail, and segmentation options. Some tools also provide advanced filtering for deeper insights.
Choosing the Right Tool Based on Store Size and Complexity
Smaller stores may do fine with a free or basic tool, while larger stores might need advanced segmentation and reporting capabilities to handle big traffic volumes.
You’ve got a sense of the available tools. Next, we’ll dive into how to analyze and interpret the data you collect.
Analyzing and Interpreting Heatmap Data
In this section, you’ll learn how to read color-coded patterns, spot anomalies, and form hypotheses for improvement. By the end, you’ll be ready to turn colorful dots into actionable to-do lists. Let’s make sense of all those red spots and scroll bars!
Establishing Baseline Metrics for Comparison
Before making changes, note your current conversion rate and average time on page. These become benchmarks to measure progress once your heatmap insights guide adjustments.
Identifying Statistical Significance in Interaction Patterns
Make sure you have enough sessions recorded. Random clicks can skew results if your sample size is too small.
Segmenting Data by Traffic Source, Device, and User Demographics
A general overview is helpful, but looking at specific groups can reveal hidden patterns. For example, tablet users might behave differently than laptop users.
Recognizing Anomalies and Outlier Behavior
Sometimes, a one-time event (like a big promotion) spikes clicks in odd places. Keep an eye out for these outliers.
Translating Visual Patterns into Actionable Insights
If 70% of users never see your “Sale” banner because they don’t scroll far enough, move that banner up or shorten the page so it’s more visible.
Combining Heatmap Data with Traditional Analytics
Match click hotspots with bounce rates or cart abandonment numbers. This combined approach can clarify why visitors leave or convert.
Creating Hypothesis-Driven Optimization Strategies
Use heatmaps to form educated guesses like “If we move this banner higher, more people will see it and make a purchase.” Then test to confirm.
You’re now equipped to interpret heatmaps. Next, let’s talk about optimizing product pages with these insights.
Optimizing Product Pages Based on Heatmap Insights
In this section, we’ll focus on product page improvements, from image placement to mobile tweaks. By the end, you’ll see how tiny layout changes can have a big impact on sales. Ready to give your product pages a makeover?
Ideal Product Image Placement Based on Eye Tracking Patterns
Heatmaps show if users skip product images that are too far down. Move key visuals to the upper portion of the page for better engagement.
Call-to-Action Button Positioning for Maximum Visibility
The “Add to Cart” button should stand out. If heatmaps show it’s rarely clicked, try changing its color or moving it closer to your product details.
Product Description Length and Format Optimization
If visitors don’t scroll through long descriptions, consider breaking text into bullet points or using collapsible sections for clarity.
Price and Shipping Information Placement Strategies
Surprise shipping costs can chase customers away. Make this info easy to see, ideally near the product price.
Cross-Sell and Upsell Element Effectiveness
Heatmaps can show if users click on related product recommendations. If not, maybe your cross-sell placement needs improvement.
User-Generated Content Placement for Maximum Impact
Testimonials and reviews can boost trust. Ensure they appear where visitors spend the most time, like right after product details.
Mobile-Specific Product Page Optimizations
Check if mobile shoppers tap the images or descriptions. Adjust font size, spacing, and button placement to avoid accidental clicks or confusion.
Product pages looking better already! Next, let’s see how navigation and site architecture can benefit from heatmaps.
Enhancing Navigation and Site Architecture
In this section, you’ll learn to polish your menu, footer, and homepage based on heatmap findings. By the end, your Shopify store’s structure will feel easier to explore for all visitors. Ready to clean up the map to your store’s treasure?
Menu Structure and Categorization Improvements
Heatmaps can reveal which menu items get the most clicks. If some categories are barely used, consider reorganizing or simplifying your menu.
Footer Optimization Based on Engagement Patterns
Users often scroll to the footer for contact info or social links. Heatmaps can confirm what they look for, letting you place important links in the right spots.
Search Box Placement and Prominence Adjustments
If many users hover around the top-right corner looking for a search box, put it where they expect it. Search is a big deal for quick finds.
Homepage Hero Section Engagement Analysis
Heatmaps show whether visitors click your hero banner or scroll right past it. A strong hero design can guide them effectively to featured products.
Internal Linking Strategy Based on Click Patterns
Try placing key product links on your homepage. If your heatmap shows intense clicking there, it means your audience wants quick navigation to certain products.
Collection Page Layout Refinements
If certain products get more clicks, highlight them or create new collections around them to catch more user interest.
Breadcrumb Implementation and Usage Tracking
Breadcrumbs help visitors keep track of where they are. A heatmap can show if these links are used or if users rely solely on the back button.
Your site structure is improving! Next, let’s tackle the checkout process and see how heatmaps can reduce abandonment.
Checkout Optimization Through Visual Analysis
In this section, you’ll learn how to spot friction points in forms, highlight trust signals, and ease mobile checkout. By the end, you’ll have a clearer, friendlier checkout process. Ready to save more carts from abandonment?
Abandoned Cart Recovery Opportunities Identified Through Heatmaps
If users click around confusedly on the checkout page, add more explanations or simplify the steps to prevent them from leaving.
Form Field Friction Detection and Resolution
Watch for repeated clicks or hover times on certain fields. This could mean unclear instructions or technical glitches that frustrate customers.
Progress Indicator Effectiveness Assessment
Showing how many steps are left in checkout can motivate users to finish. If your heatmap shows confusion, simplify or clarify your progress bar.
Trust Signal Placement for Maximum Impact
Badges like SSL security or money-back guarantees are crucial. If few clicks happen near these badges, move them into a more visible spot.
Payment Method Display Optimization
Heatmaps can show if users click a payment option expecting more info. Make sure each method is clearly explained and easy to select.
Mobile Checkout Specific Pain Points
Mobile screens require bigger buttons and fewer fields. If heatmap data shows heavy zooming or missed taps, simplify for smaller screens.
Guest Checkout vs. Account Creation Behavior Patterns
Some shoppers prefer a quick guest checkout. If they’re abandoning at account creation prompts, consider letting them checkout first, then sign up later.
Now your checkout process is smoother! Let’s see how real stores are benefiting from heatmaps in practice.
Case Studies: Successful Heatmap Implementation
In this section, you’ll find stories of small boutiques and big enterprises alike, all using heatmaps to boost conversions. By the end, you’ll see how these methods can work for you, regardless of your store size. Ready for some real-world inspiration?
Small Boutique Shopify Store Conversion Rate Improvement
A small clothing store discovered most customers ignored their slideshow. By replacing it with a static banner that highlighted a sale, their conversion rates jumped.
Enterprise-Level Shopify Plus Navigation Optimization
A large retailer noticed users repeatedly clicked a hidden menu link. They moved it to the top navigation, increasing product page visits by 15%.
Product Page Redesign Based on Attention Heatmaps
One business rearranged its product images to the left side (where most visitors looked first) and saw a notable boost in add-to-cart clicks.
Checkout Abandonment Reduction Through Form Heatmaps
After spotting high drop-offs at the “zip code” field, a merchant auto-filled city and state data, cutting cart abandonment in half.
Mobile Experience Optimization Case Study
A footwear company saw that phone users accidentally clicked the size chart link too often. They moved it under a clear button, reducing confusion.
Seasonal Campaign Effectiveness Measurement
During Black Friday, one store used heatmaps to confirm visitors focused on the deal banner, validating that their limited-time offer was grabbing attention.
Cross-Device Customer Journey Improvement
By comparing desktop and mobile heatmaps, another store streamlined its site for phone users, leading to a big boost in smartphone sales.
Case studies show the impact is real. Next, let’s avoid common pitfalls when using heatmaps.
Common Heatmap Implementation Mistakes to Avoid
This section highlights typical errors, like mixing up correlation and causation or ignoring mobile data. By the end, you’ll know which traps to dodge to keep your insights accurate. Ready to steer clear of trouble?
Misinterpreting Correlation as Causation in Visual Data
Just because users click an area a lot doesn’t mean it drives sales. Always validate findings with other metrics or A/B tests.
Over-Optimizing for Clicks Without Considering Context
A click hotspot could be accidental or curiosity-driven. Focus on broader patterns, not just raw click numbers.
Neglecting Mobile-Specific Heatmap Analysis
Mobile visitors are often a huge segment. If you ignore their behavior, you miss crucial optimization opportunities.
Failing to Segment Data Properly for Meaningful Insights
Grouping all visitors together can hide differences between new and returning customers, or between various traffic sources.
Not Accounting for Employee and Bot Traffic in Results
Make sure to filter out internal (employee) visits and automated bots to avoid skewed data.
Implementing Changes Without Proper A/B Testing Validation
Before finalizing a new layout, run a quick test. Heatmap data gives clues, but testing confirms if your change truly works.
Focusing on Minor Issues While Missing Major Opportunities
Don’t get lost in tiny details while ignoring big problems like a confusing checkout flow. Prioritize the highest-impact issues first.
Now that we’ve covered mistakes to avoid, let’s explore some advanced techniques to level up your heatmap game.
Advanced Heatmap Analysis Techniques
In this section, you’ll learn about integrating heatmap data with segmentation, funnel visualization, and predictive modeling. By the end, you’ll be thinking like a data pro, ready to tackle big optimization goals. Ready to go beyond basics?
Integrating Heatmap Data with Customer Segmentation
Break down heatmap results by demographics or purchase history to see how loyal customers behave differently from new ones.
Cohort Analysis Through Heatmap Filtering
Compare a group of users who first visited during a sale with those who came later. Differences might reveal how discounts affect browsing patterns.
Funnel Visualization with Heatmap Overlay
Map heatmap data onto each step of your funnel, spotting where drop-offs occur and which elements attract attention or cause confusion.
Predictive Behavior Modeling Using Historical Heatmap Data
Use past patterns to predict future user actions, helping you optimize site changes before you even roll them out widely.
Heat Mapping Customer Lifetime Value Segments
Highlight the behavior of high-value customers to see if they explore more pages or interact with certain products more frequently.
Multi-Page Journey Analysis Through Connected Heatmaps
Track a single user’s path across multiple pages to understand how they move through your site.
Competitive Benchmarking Through Comparable Metrics
While you won’t see competitors’ heatmaps directly, you can compare your heatmap-based metrics (like click-through rates) against industry averages.
Impressive stuff! Next, let’s peek into future trends in customer behavior analysis.
Future Trends in Customer Behavior Analysis
This section offers a glimpse of where heatmaps and analytics might go next, from AI-driven insights to VR store tracking. By the end, you’ll see how staying informed can keep you ahead of the competition. Curious about tomorrow’s ecommerce possibilities?
AI-Driven Heatmap Interpretation and Recommendations
Tools may soon auto-suggest layout tweaks based on real-time data, saving you from manual guesswork.
Predictive Behavior Modeling Through Machine Learning
Advanced algorithms could forecast which elements users will click next, optimizing your site on the fly.
Integration with Augmented and Virtual Reality Shopping Experiences
As AR and VR options expand, heatmaps might track gaze and gesture data in virtual stores.
Cross-Channel Behavior Mapping Including Offline Touchpoints
Future analytics may merge in-store data (like foot traffic) with online heatmaps for a 360-degree view of shopper behavior.
Real-Time Personalization Based on Heatmap Patterns
Imagine adjusting your homepage layout instantly if the heatmap shows new visitors ignoring a main product section.
Voice and Gesture Interaction Heatmaps for Emerging Interfaces
As voice commands become more common, “heatmaps” might expand to track verbal interactions or hand motions.
Privacy-First Anonymous Behavior Aggregation Techniques
Expect stricter rules that ensure data is anonymized, pushing tools to gather less personal info while still providing key insights.
Exciting times ahead! Next, let’s walk through a practical implementation roadmap for Shopify merchants.
Implementation Roadmap for Shopify Merchants
In this section, you’ll learn the step-by-step process for rolling out a heatmap solution. We’ll also discuss KPIs to track and how to train your team. Ready to launch a successful heatmap project?
Assessment of Current Analytics Capabilities
Check your existing tools. Identify gaps in your data so you know what you want heatmaps to fill.
Selection Criteria for Appropriate Heatmap Solution
Consider factors like budget, ease of use, advanced reporting, and Shopify compatibility.
Implementation Timeline and Resource Allocation
Plan who will install the app, who will interpret the data, and when you’ll start analyzing results.
Key Performance Indicators for Measuring Success
Track metrics like conversion rate, time on page, or cart abandonment before and after using heatmaps to see direct improvements.
Integration with Existing Optimization Workflows
If you already run A/B tests, add heatmap insights to guide your test hypotheses and validate changes.
Team Training and Insight Distribution Strategy
Teach staff how to read heatmaps, or designate a point person to share findings with your marketing, design, and support teams.
Continuous Improvement Process Framework
Review heatmap data regularly. Ecommerce is dynamic, so your site should evolve with changing customer behaviors.
Your roadmap is set! Finally, let’s wrap things up with key takeaways in our conclusion.
Conclusion
Heatmaps offer a powerful, visual way to understand how your Shopify customers behave. By blending traditional analytics with colorful interaction data, you gain insights that go beyond simple metrics. Applying heatmap findings can improve product pages, streamline checkout, and enhance site navigation, all while boosting conversion rates.
Keep in mind that heatmaps are just one piece of the puzzle. A balanced approach includes looking at numbers, conducting A/B tests, and listening to customer feedback. Over time, building a culture of data-driven decisions can transform your Shopify store into a finely tuned selling machine.
Quick reminder: If you’re looking for a simpler, more integrated way to track these strategies, consider the Growth Suite application for Shopify. It can streamline your optimization processes, helping you track results and scale your business faster.
Good luck on your heatmap journey, and happy optimizing!
References
- GemPages. (2024, December 27). 5+ Shopify Heatmap Tools to Skyrocket eCommerce Growth[2025].
- Transtore. (2024, July 8). How Heatmaps Help You Master Your Shopify Store.
- RocketCroLab. (2025, January 15). Improving Shopify Store Layout Using Heat Maps: What You Need to Know.
- Supl.ai. (2023, August 7). Using Heatmaps on Shopify Stores for Conversion Rate Optimization.
- Lucky Orange. (2025, February 17). Lucky Orange Heatmaps & Replay – Shopify App Store.
- Webyze. (2023, January 10). HeatMap by Webyze – Know where your customers click with our Shopify app.
- Cheng, Z. (2016, September 15). Complex heatmaps reveal patterns and correlations in multidimensional genomic data. Bioinformatics, 32(18), 2847-2849. Retrieved from https://pubmed.ncbi.nlm.nih.gov/27207943/
- Abbas, M. A., et al. (2024, November 29). Advanced Customer Behavior Tracking and Heatmap Analysis with YOLOv5 and DeepSORT in Retail Environment. Semantic Scholar. Retrieved from https://www.semanticscholar.org/paper/56023fea1ea9c916dfb6beddd87473fc0d365451
- Choi, Y. J., et al. (2023, June 23). Analyzing the number of articles with network meta-analyses using chord diagrams and temporal heatmaps over the past 10 years: Bibliometric analysis. PLOS ONE. Retrieved from https://www.ncbi.nlm.nih.gov/pmc/articles/PMC10289580/