
Ever wonder why visitors browse your Shopify store for hours but never buy anything? Or why your cart abandonment rate makes you want to hide under your desk? Here’s a shocking truth: 69.57% of online shopping carts are abandoned, and most store owners have no idea why.
But what if I told you that hidden within your analytics data lies a treasure map? A map that shows exactly where your customers get stuck, frustrated, or simply give up on their journey to purchase. That’s the power of using analytics to identify friction points in your customer journey.
By the time you finish reading this guide, you’ll know how to:
- Spot the hidden barriers that are costing you sales
- Use free and paid tools to track customer behavior
- Turn data into actionable improvements that boost conversions
- Create a smooth customer experience that keeps people coming back
Ready to transform those abandoned carts into completed sales? Let’s dive in.
The Hidden Cost of Customer Friction
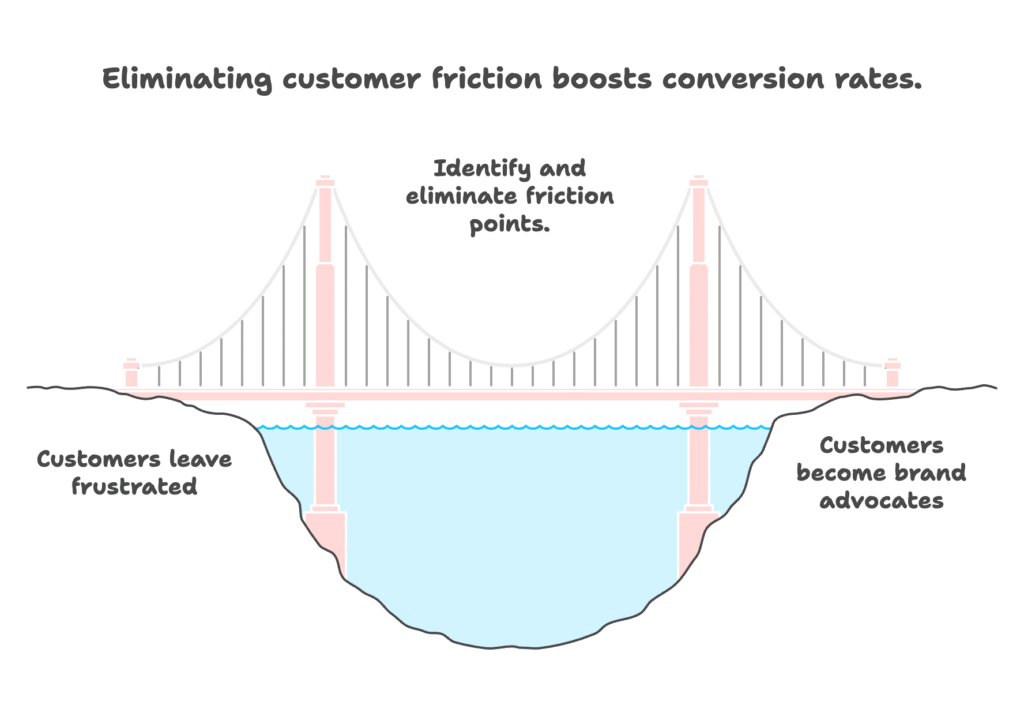
In this section, you’ll discover why friction points are silently draining your revenue and how eliminating them can dramatically boost your conversion rates.
Picture this: A potential customer lands on your Shopify store, excited about a product they saw on social media. But after just 30 seconds, they’re gone. What happened? Most likely, they hit a friction point.
Customer friction is anything that makes it harder for visitors to complete their desired action – whether that’s finding a product, adding it to cart, or checking out. Think of it as digital quicksand that slowly swallows your conversion rates.
The numbers don’t lie. Research shows that even a one-second delay in page load time can reduce conversions by 7%. More complex friction points, like confusing navigation or a complicated checkout process, can cut your conversion rates in half.
But here’s the good news: most friction points are fixable. The challenge isn’t solving them – it’s finding them in the first place. That’s where analytics becomes your best friend.
Understanding friction isn’t just about lost sales today. Every visitor who leaves frustrated might never return, and they certainly won’t recommend your store to friends. In contrast, removing friction points can increase customer satisfaction, boost repeat purchases, and turn buyers into brand advocates.
Now that you understand why friction matters, let’s explore what it actually looks like in the real world of Shopify stores.
Defining Customer Journey Friction Points
Here, you’ll learn to recognize different types of friction and understand how they specifically impact Shopify stores compared to other ecommerce platforms.
Not all friction is created equal. Some friction points are like small speed bumps – they slow customers down but don’t stop them completely. Others are like roadblocks that bring the journey to a screeching halt.
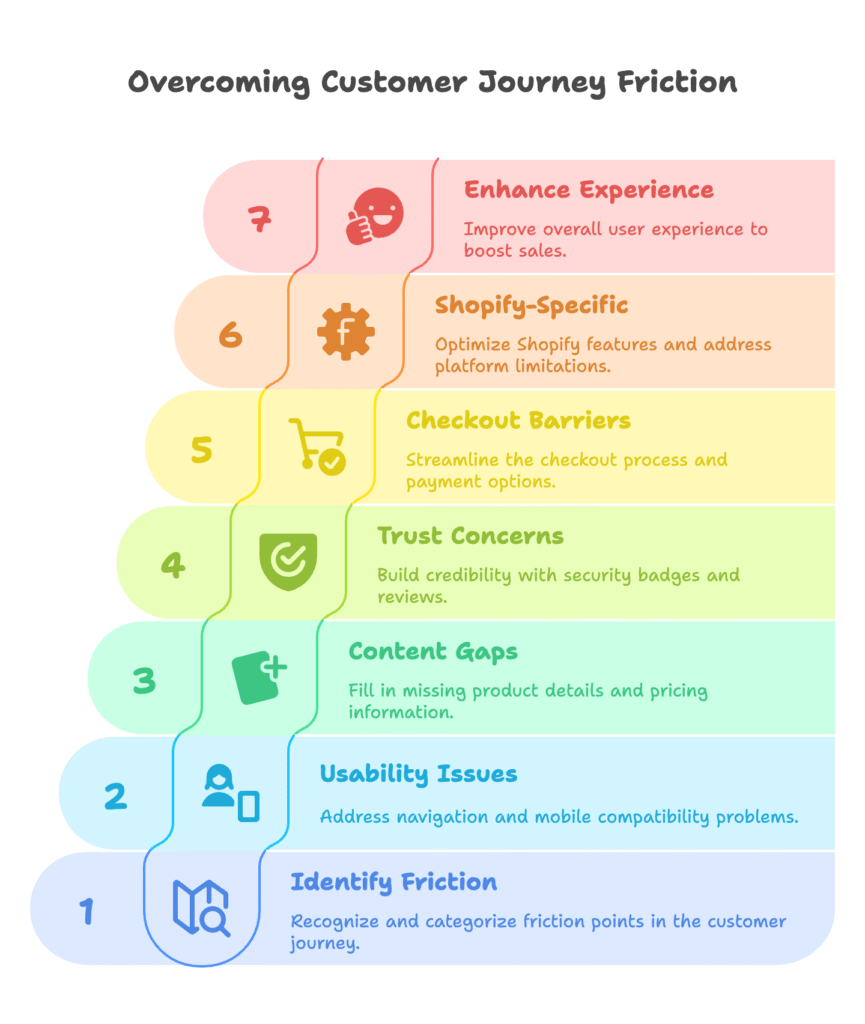
Friction points fall into four main categories:
Usability and Navigation Issues
These are the “I can’t find what I’m looking for” problems. Think unclear menu structures, broken search functions, or mobile sites that don’t work properly on phones.
Content and Information Gaps
When customers can’t get the information they need to make a decision. Missing product details, unclear pricing, or absent shipping information all fall here.
Trust and Credibility Concerns
Anything that makes customers question whether your store is legitimate and secure. This includes missing security badges, no customer reviews, or unclear return policies.
Sales and Checkout Process Barriers
The final hurdles before purchase. Long checkout forms, limited payment options, or unexpected fees at the last moment.
Shopify-specific friction often relates to theme limitations, app conflicts, or platform-specific features that aren’t optimized for your audience. For example, Shopify’s checkout process is standardized, which means you have less control over customization compared to other platforms.
The relationship between user experience and conversion rates is direct: better experience equals more sales. But how do you know which parts of your customer experience need improvement? That’s where mapping the complete customer journey becomes essential.
Understanding the Shopify Customer Journey
In this section, you’ll map out every step your customers take and identify the specific touchpoints where friction commonly occurs in Shopify stores.
Your customer journey isn’t just about the few minutes someone spends on your website. It’s a complex dance that begins long before they visit your store and continues long after they make a purchase.
The Five Stages of Customer Journey
Awareness: Customers discover your brand through ads, social media, or search results. Friction here might be slow-loading landing pages or unclear value propositions.
Consideration: They’re evaluating your products against competitors. Common friction points include insufficient product information, poor search functionality, or difficulty comparing options.
Acquisition: The moment of purchase. This is where most friction occurs – complex checkout processes, limited payment options, or unexpected costs.
Service: Post-purchase experience including shipping updates, customer support, and problem resolution. Poor communication here creates friction for future purchases.
Loyalty: Repeat purchases and referrals. Friction in loyalty programs or account management can prevent customers from returning.
Shopify-Specific Touchpoints
Unlike custom-built ecommerce sites, Shopify stores have standardized touchpoints that create unique opportunities and challenges:
- Theme-based design limitations that might not match your brand perfectly
- App ecosystem dependencies where third-party apps can create conflicts
- Standardized checkout process with limited customization options
- Built-in analytics that provide specific insights but may lack depth
Understanding these touchpoints is crucial, but the real magic happens when you start measuring what’s actually happening at each stage. Ready to dive into the analytics foundation that makes friction detection possible?
The Analytics Foundation for Friction Detection
You’ll discover the essential tools and metrics you need to start identifying friction points, from Shopify’s built-in analytics to powerful third-party solutions.
Think of analytics as your detective toolkit. Without the right tools, you’re just guessing where problems might be. With proper analytics setup, every click, scroll, and abandoned cart tells a story about your customer experience.
Essential Shopify Analytics Tools
Native Shopify Analytics gives you the basics – sales data, top products, and traffic sources. It’s like having a good pair of reading glasses, but sometimes you need a microscope.
The built-in reports show you what happened but often leave you wondering why. You can see that 100 people visited a product page and only 5 bought, but you can’t see where the other 95 got stuck.
Google Analytics integration is your next step up. When properly configured for ecommerce tracking, it reveals customer behavior patterns that Shopify’s native analytics miss. You can see bounce rates, time on page, and conversion paths.
But here’s where many store owners make a mistake: they set up Google Analytics and think they’re done. Setup is just the beginning. The real value comes from knowing which metrics to track.
Key Metrics That Reveal Friction Points
Cart Abandonment Rate: If it’s above 70%, you likely have checkout friction. If it’s above 80%, you definitely do.
Bounce Rate by Page: High bounce rates on product pages suggest content or loading issues. High bounce rates on your homepage indicate messaging or navigation problems.
Time on Page vs. Conversion: Long time on page with low conversion often means confusion or missing information.
Exit Page Analysis: Where do people leave your site? These pages are friction hotspots.
These metrics give you the foundation, but to really understand customer behavior, you need to go deeper. Let’s explore the advanced analytics methods that reveal exactly where and why customers get stuck.
Advanced Analytics Methods for Friction Identification
Here you’ll learn sophisticated techniques like heatmap analysis and session recordings that show you exactly how customers interact with your store.
Basic analytics tell you what happened. Advanced analytics show you how it happened. It’s the difference between knowing someone left your store and watching them struggle with a broken search button for five minutes before giving up.
Behavioral Analytics Techniques
Heatmap Analysis is like having X-ray vision for your website. You can see exactly where customers click, how far they scroll, and which elements they completely ignore.
Red-hot areas show high engagement, while cold blue zones reveal ignored content. But here’s a pro tip: what customers don’t click is often more revealing than what they do. If your “Add to Cart” button is ice cold, you’ve found a major friction point.
Session Recordings take you inside your customers’ minds. You watch real visitors navigate your store, see them hesitate before clicking, and witness the exact moment they decide to leave.
These recordings often reveal friction points that no amount of data analysis could uncover. Like customers trying to click non-clickable elements, or getting confused by similar-looking buttons.
Conversion Funnel Analysis shows you the percentage of customers who complete each step of your sales process. A typical funnel might look like:
- 100 visitors land on product page
- 30 add product to cart (70% drop-off)
- 20 begin checkout (33% cart abandonment)
- 15 complete purchase (25% checkout abandonment)
Each drop-off point represents a friction opportunity. But remember, some drop-off is normal – not everyone who visits is ready to buy.
Customer Journey Analytics Implementation
Site Path Analysis reveals the routes customers take through your store. You might discover that successful buyers often visit your About page, suggesting trust is crucial for conversions.
Cross-Channel Behavior Tracking is increasingly important as customers jump between devices and platforms. Someone might discover you on Instagram, research on their laptop, and buy on their phone days later.
Understanding these patterns helps you identify friction points that span multiple touchpoints. But collecting all this data is just the first step – you need solid strategies for gathering both numbers and customer insights.
Data Collection Strategies
In this section, you’ll learn how to gather both quantitative data (the numbers) and qualitative insights (the reasons behind the numbers) to build a complete picture of customer friction.
Imagine trying to solve a puzzle with only half the pieces. That’s what happens when you rely solely on quantitative data. You know that customers are leaving, but not why they’re leaving.
Quantitative Data Sources
Website Analytics provide the foundation – traffic sources, page views, conversion rates, and user flows. This data is objective and measurable, giving you clear benchmarks for improvement.
A/B Testing is your friction-fighting laboratory. Test different versions of pages, buttons, or checkout flows to see which reduces friction. But here’s the key: test one element at a time. Change everything at once, and you won’t know what made the difference.
Effective A/B testing for friction points might include:
- Testing different checkout form lengths
- Comparing button colors and text
- Evaluating different navigation structures
- Trying various product page layouts
Conversion Tracking across multiple touchpoints helps you understand the complete customer journey. Someone might see your ad, visit your site, leave, read reviews elsewhere, and return to purchase days later.
Qualitative Data Gathering
Customer Feedback through surveys and reviews gives you the “why” behind the numbers. Ask specific questions like “What almost prevented you from completing your purchase?” or “What information was missing that you needed?”
Support Ticket Analysis is an often-overlooked goldmine. The questions customers ask and problems they report reveal friction points you might never discover through analytics alone.
User Testing involves watching real people attempt to complete tasks on your site. Even testing with 5 users can reveal major friction points that thousands of analytics data points missed.
The magic happens when you combine quantitative and qualitative data. Numbers tell you where friction occurs, and customer feedback tells you why. But Shopify stores face unique challenges that generic advice doesn’t address. Let’s dive into the specific friction points that plague Shopify merchants.
Shopify-Specific Friction Point Analysis
You’ll explore the most common friction points that specifically affect Shopify stores, from theme limitations to checkout process barriers, and learn how to identify them in your own store.
While all ecommerce stores face friction challenges, Shopify stores have unique characteristics that create specific problem areas. Understanding these platform-specific issues can help you focus your optimization efforts where they’ll have the biggest impact.
Navigation and Usability Issues
Theme-Related Navigation Problems are surprisingly common. Many beautiful Shopify themes prioritize aesthetics over functionality, leading to:
- Hidden or unclear menu structures
- Search bars that are hard to find
- Category pages that don’t clearly show product benefits
- Mobile navigation that breaks on certain devices
Here’s a reality check: if customers can’t find products, they can’t buy them. Even the most gorgeous theme is useless if it confuses visitors.
Mobile Responsiveness is critical since over 55% of ecommerce traffic comes from mobile devices. Shopify themes are supposed to be mobile-friendly, but “responsive” doesn’t always mean “optimized for mobile shopping behavior.”
Product Page Friction Points
Inadequate Product Information is the number one conversion killer. Customers can’t touch, try, or examine products online, so your product pages must overcompensate with detailed information.
Common product page friction includes:
- Low-quality or insufficient product images
- Missing size guides or dimension information
- Unclear product variants and options
- Absent or buried customer reviews
- Missing trust signals like return policies
Complex Product Variants can overwhelm customers. If you sell t-shirts in 5 colors and 7 sizes, that’s 35 possible combinations. Poor variant organization leads to confusion and abandonment.
Checkout Process Barriers
Shopify’s standardized checkout is both a blessing and a curse. It’s tested and optimized, but you have limited ability to customize it for your specific audience needs.
Common Shopify checkout friction points include:
- Requiring account creation before purchase
- Limited payment method options
- Unexpected shipping costs at final step
- Overly long contact information forms
- Poor error messaging when form submission fails
The good news? Understanding these common issues means you know exactly what to look for in your analytics. But you need the right tools to dig deep into the data. Let’s explore the technology stack that makes friction detection possible.
Tools and Technologies for Friction Analysis
Here you’ll discover the specific tools that can help you uncover friction points, from free Shopify features to advanced third-party analytics platforms.
Having the right tools for friction analysis is like having the right equipment for a treasure hunt. You could dig with your hands, but a metal detector makes finding gold much easier and faster.
Native Shopify Analytics Features
Shopify’s Built-in Reports provide a solid starting point for friction detection:
- Sales reports show you which products convert well and which don’t
- Customer behavior reports reveal patterns in purchase timing and frequency
- Marketing reports help identify which traffic sources convert best
- Live view shows real-time visitor activity on your store
But here’s what many merchants miss: the most valuable insights come from combining multiple reports. For example, comparing your top traffic sources with your highest converting sources often reveals friction in your marketing funnel.
Shopify’s Customer Timeline feature shows individual customer journeys, helping you spot patterns in successful vs. unsuccessful buyer behavior.
Third-Party Analytics Solutions
Google Analytics 4 (GA4) is essential for serious friction analysis. When properly configured with enhanced ecommerce tracking, it reveals:
- Which pages cause the highest exit rates
- How long customers spend in different funnel stages
- Which traffic sources bring the most qualified visitors
- Device and browser-specific conversion issues
Heatmap and Session Recording Tools like Hotjar, Crazy Egg, or Lucky Orange show you exactly how customers interact with your pages. These tools reveal friction that numbers alone can’t capture.
Specialized Ecommerce Analytics platforms like Triple Whale or Northbeam provide advanced attribution modeling, helping you understand the complete customer journey across multiple touchpoints.
Customer Feedback Tools such as Gorgias for support tickets, Okendo for reviews, or Typeform for surveys help you gather the qualitative insights that explain your quantitative data.
Tools are powerful, but they’re only as good as the strategy behind them. The most successful friction detection comes from systematic customer journey mapping that reveals exactly where and why problems occur.
Implementing Customer Journey Mapping
You’ll learn to create detailed customer personas and journey maps that reveal hidden friction points and optimization opportunities throughout your sales process.
Customer journey mapping is like creating a GPS for your sales process. Without it, you’re driving blind, hoping customers somehow find their way to checkout. With it, you can identify every pothole, traffic jam, and confusing intersection along the route.
Creating Effective Customer Personas
Demographic and Psychographic Research goes beyond basic age and location data. For friction detection, you need to understand:
- Shopping behavior patterns – Do they research extensively or buy impulsively?
- Technology comfort level – Are they comfortable with online shopping or need extra guidance?
- Decision-making triggers – What convinces them to buy vs. what makes them hesitate?
- Pain points and motivations – What problems are they trying to solve?
Here’s a crucial insight: different customer segments experience different friction points. First-time visitors might struggle with navigation, while returning customers might be frustrated by a complex checkout process.
Behavioral Pattern Identification helps you understand how different customer types move through your store. Some customers go straight to search, others browse categories, and some need social proof before they’ll even consider purchasing.
Journey Mapping Methodology
Step-by-Step Journey Creation involves documenting every possible path a customer might take, from initial awareness to post-purchase follow-up.
A comprehensive journey map includes:
- Touchpoint identification – Every interaction point with your brand
- Customer actions – What they’re trying to accomplish at each stage
- Emotions and motivations – How they’re feeling and what’s driving them
- Potential friction points – Where they might get stuck or frustrated
- Success metrics – How you’ll measure improvement at each stage
Emotion and Experience Mapping is often overlooked but critically important. A customer’s emotional state affects how they perceive friction. Someone excited about a purchase might tolerate minor inconveniences, while someone uncertain might abandon at the first sign of trouble.
Journey mapping reveals friction patterns, but to truly optimize your store, you need advanced detection techniques that can predict and prevent friction before it happens.
Advanced Friction Detection Techniques
In this section, you’ll discover sophisticated methods like segmentation analysis and predictive analytics that help you identify friction patterns and prevent customer abandonment before it occurs.
Basic friction detection shows you where customers currently get stuck. Advanced techniques help you predict where they might get stuck in the future and proactively address problems before they impact sales.
Segmentation and Cohort Analysis
Customer Segment-Specific Friction Patterns reveal that different groups experience different obstacles. For example:
- Mobile users might struggle with small buttons or slow loading
- International customers could be confused by shipping costs or currency
- First-time visitors may need more trust signals than returning customers
- High-value customers might expect premium support options
Behavioral Cohort Analysis compares how different groups of customers perform over time. You might discover that customers who read product reviews convert 40% more often, suggesting that customers who don’t see reviews are experiencing information friction.
Geographic and Demographic Variations help you understand cultural and technological differences in friction perception. What feels “fast and efficient” to one group might feel “rushed and impersonal” to another.
Predictive Analytics for Friction Prevention
Machine Learning Applications can analyze thousands of customer interactions to identify early warning signs of abandonment. These systems can predict when someone is likely to leave and trigger interventions.
For example, if analytics show that customers who spend more than 3 minutes on a product page without adding to cart have a 90% abandonment rate, you could automatically trigger a help chat or discount offer.
Real-Time Friction Identification uses behavioral triggers to spot friction as it happens. If a customer clicks the same button multiple times, tries to interact with non-clickable elements, or shows other signs of confusion, you can intervene immediately.
Predictive Modeling for Customer Abandonment helps you identify which visitors are most likely to convert and which ones need extra encouragement. This allows you to allocate resources more effectively and provide personalized experiences.
Advanced techniques are powerful, but they’re most effective when applied to the most common friction points. Let’s explore the specific problems that plague most Shopify stores and their proven solutions.
Common Shopify Friction Points and Solutions
You’ll discover the most frequent friction points found in Shopify stores and learn practical, proven solutions for each one.
After analyzing thousands of Shopify stores, certain friction patterns appear repeatedly. Understanding these common issues and their solutions can help you quickly identify and fix problems that might be costing you 20-30% of your potential sales.
Homepage and Landing Page Issues
Unclear Value Proposition is the number one homepage friction point. Visitors should understand what you sell and why they should buy from you within 5 seconds of landing on your site.
Solution: Use a clear headline that states your main benefit, followed by a subheadline that explains how you deliver that benefit. Test different value propositions to see which resonates best with your audience.
Weak Call-to-Action Placement leaves visitors wondering what to do next. If your main CTA isn’t visible above the fold, you’re creating unnecessary friction.
Solution: Place your primary call-to-action prominently above the fold. Use action-oriented language like “Shop Now,” “Get Started,” or “Find Your Perfect [Product].”
Slow Page Loading creates immediate friction. If your homepage takes more than 3 seconds to load, you’re losing customers before they even see your products.
Solution: Optimize images, choose a fast theme, minimize apps, and consider a content delivery network (CDN) for faster global loading.
Product Discovery Challenges
Poor Search Functionality frustrates customers who know what they want but can’t find it. Default Shopify search often returns irrelevant results or misses obvious matches.
Solution: Implement smart search apps like Searchanise or Fast Simon that provide autocomplete, typo tolerance, and better result ranking.
Overwhelming Product Categories create decision paralysis. When customers face too many choices without clear guidance, they often choose nothing.
Solution: Create logical category hierarchies with clear descriptions. Use filtering options to help customers narrow down choices. Consider guided selling tools for complex product catalogs.
Inadequate Product Recommendations miss opportunities to showcase relevant items. Generic “related products” sections often show random items instead of truly relevant suggestions.
Solution: Use AI-powered recommendation engines that consider customer behavior, purchase history, and product relationships to show truly relevant suggestions.
Trust and Security Concerns
Missing Security Indicators make customers question whether it’s safe to enter payment information. This is especially critical for new or unknown brands.
Solution: Display security badges prominently near payment areas. Include SSL certificates, payment processor logos, and any security certifications you have.
Absent or Hard-to-Find Return Policy creates purchase anxiety. Customers want to know they can return items if needed, and hidden policies suggest you’re trying to hide something.
Solution: Make return policies easily accessible from product pages, cart, and checkout. Consider offering generous return windows to reduce purchase hesitation.
Lack of Social Proof leaves customers wondering if others have had positive experiences. Without reviews, testimonials, or social mentions, customers have no validation for their purchase decision.
Solution: Implement review systems, showcase customer testimonials, display social media mentions, and include trust badges from recognized organizations.
Identifying friction points is only half the battle. The real challenge lies in systematically implementing solutions and measuring their impact. Let’s explore proven strategies for turning friction insights into conversion improvements.
Implementation Strategies
Here you’ll learn how to prioritize friction fixes for maximum impact and implement testing strategies that ensure your optimizations actually improve conversions.
Knowing where friction exists is powerful, but knowing which friction to fix first can make or break your optimization efforts. Fix the wrong things, and you waste time and resources. Fix the right things in the right order, and you can see dramatic conversion improvements within weeks.
Priority Matrix for Friction Point Resolution
Impact vs. Effort Assessment helps you focus on changes that deliver the biggest return on investment. Plot each identified friction point on a matrix:
- High Impact, Low Effort – Fix these first (quick wins)
- High Impact, High Effort – Plan these for larger projects
- Low Impact, Low Effort – Handle during maintenance periods
- Low Impact, High Effort – Generally avoid unless strategic
Quick Wins vs. Long-Term Projects should be balanced in your optimization roadmap. Quick wins build momentum and demonstrate ROI, while long-term projects address fundamental issues.
Examples of quick wins include:
- Adding trust badges to checkout pages
- Clarifying shipping costs on product pages
- Improving button contrast and visibility
- Adding customer reviews to product pages
Resource Allocation for Maximum ROI means focusing your limited time and budget on friction points that affect the most customers and have the highest potential impact on revenue.
Testing and Validation Approaches
A/B Testing Setup and Execution is crucial for validating friction fixes. Don’t assume that removing apparent friction will improve conversions – test to be sure.
Effective A/B testing for friction reduction follows these principles:
- Test one element at a time to isolate what causes improvement
- Run tests long enough to account for day-of-week and seasonal variations
- Ensure adequate sample size for statistical significance
- Test with your actual traffic, not just specific segments
Multivariate Testing can be useful for complex friction points where multiple elements interact. For example, testing different combinations of checkout form length, payment options, and trust signals simultaneously.
Statistical Significance and Confidence Intervals ensure your results are reliable, not just lucky. A 95% confidence level is standard, meaning you can be 95% sure that your results aren’t due to random chance.
Implementation without measurement is just guessing. Let’s explore how to track the success of your friction reduction efforts and continuously improve your results.
Measuring Success and Continuous Improvement
You’ll learn which metrics truly matter for measuring friction reduction success and how to create a sustainable optimization process that continuously improves your conversion rates.
Fixing friction points feels great, but unless you can measure the impact, you don’t know if your efforts are actually working. The right measurement framework turns friction reduction from a guessing game into a systematic growth strategy.
Key Performance Indicators for Friction Reduction
Conversion Rate Improvements are the ultimate measure of friction reduction success. Track conversion rates at multiple levels:
- Overall site conversion rate – The big picture metric
- Product page conversion rate – How well products convert browsers to buyers
- Cart-to-checkout conversion – Measures cart abandonment reduction
- Checkout completion rate – Tracks final-step friction elimination
Customer Satisfaction and Net Promoter Score (NPS) reveal whether friction reduction improves the overall experience. You can increase conversions while making customers less happy if you’re not careful.
Revenue Per Visitor (RPV) is often more important than pure conversion rate. Sometimes reducing friction slightly decreases conversion rate but increases average order value, resulting in higher overall revenue.
Customer Lifetime Value (CLV) shows the long-term impact of friction reduction. Improving the customer experience often leads to more repeat purchases and higher lifetime value.
Ongoing Monitoring and Optimization
Regular Analytics Review Cycles ensure you don’t miss new friction points that develop over time. Set up monthly or quarterly reviews to analyze:
- Changes in conversion funnel performance
- New patterns in customer behavior
- Seasonal variations in friction points
- Impact of new product launches or campaigns
Seasonal and Promotional Adjustments are crucial because customer behavior changes during sales periods, holidays, and special events. What works during normal periods might create friction during high-traffic sales.
Customer Feedback Integration keeps your optimization efforts grounded in real customer needs. Regular surveys, review analysis, and support ticket review help you identify emerging friction points before they show up in analytics.
Even with the best measurement practices, it’s easy to make mistakes that undermine your friction reduction efforts. Let’s explore the most common pitfalls and how to avoid them.
Common Pitfalls and How to Avoid Them
In this section, you’ll discover the most frequent mistakes merchants make when analyzing friction and implementing solutions, plus proven strategies to avoid these costly errors.
Learning from others’ mistakes is cheaper than making your own. After working with hundreds of Shopify stores, certain patterns of errors appear repeatedly. Avoiding these pitfalls can save you months of wasted effort and thousands in lost revenue.
Analytics Implementation Mistakes
Creating Data Silos happens when different tools don’t communicate with each other. You end up with incomplete pictures and conflicting insights.
How to avoid: Choose tools that integrate well together. Ensure your analytics stack shares data appropriately. Document what each tool measures and how metrics relate to each other.
Overcomplicating Metrics leads to analysis paralysis. When you track everything, you focus on nothing.
How to avoid: Start with 3-5 core metrics that directly relate to revenue. Add complexity gradually as you master the basics. Remember: simple metrics consistently applied beat complex metrics sporadically reviewed.
Misinterpreting Data Without Context leads to wrong conclusions. A spike in cart abandonment might look alarming until you realize it coincided with a shipping delay announcement.
How to avoid: Always consider external factors when analyzing data. Look at trends over time rather than isolated data points. Combine quantitative data with qualitative insights.
Optimization Strategy Errors
Ignoring Cross-Channel Customer Behavior creates a fragmented optimization approach. Customers don’t think in channels – they think in experiences.
How to avoid: Map complete customer journeys across all touchpoints. Ensure friction reduction efforts consider email, social media, ads, and website interactions as connected experiences.
Overlooking Post-Purchase Opportunities misses chances to reduce friction for future purchases. Poor post-purchase experience creates friction for repeat business.
How to avoid: Include post-purchase touchpoints in your friction analysis. Optimize order confirmation, shipping communication, and customer service interactions.
Failing to Act on Insights is the biggest waste of analytics investment. Knowing about friction without fixing it helps nobody.
How to avoid: Create action plans for every friction point identified. Set deadlines for implementation. Review progress regularly. Remember: imperfect action beats perfect analysis.
Understanding common mistakes helps, but seeing real examples of successful friction elimination provides the clearest roadmap for your own optimization efforts.
Case Studies and Real-World Examples
You’ll explore real Shopify stores that successfully eliminated friction points, learn from their strategies, and discover how to apply their lessons to your own store.
Theory is helpful, but real results from actual stores provide the clearest proof that friction elimination works. These case studies show exactly what successful merchants did and the results they achieved.
Successful Friction Elimination Case Studies
Case Study 1: Fashion Retailer Checkout Optimization
A women’s fashion store noticed a 78% cart abandonment rate and identified the checkout process as the primary friction point.
The Problem: Their checkout required account creation, asked for unnecessary information, and didn’t clearly show shipping costs until the final step.
The Solution: They implemented guest checkout, reduced form fields from 12 to 6, and added a shipping calculator on product pages.
The Results: Cart abandonment dropped to 65%, overall conversion rate increased by 23%, and revenue per visitor improved by 31%.
Case Study 2: Electronics Store Mobile Optimization
A tech accessories store discovered that mobile users had a 40% lower conversion rate than desktop users.
The Problem: Product images were too small on mobile, the add-to-cart button was hard to tap, and product specifications were difficult to read.
The Solution: They redesigned product pages specifically for mobile, implemented swipeable image galleries, and created accordion-style product details.
The Results: Mobile conversion rate increased by 45%, mobile revenue grew by 67%, and overall customer satisfaction scores improved significantly.
Lessons from Failed Implementations
The Over-Optimization Trap
One merchant tried to eliminate all friction simultaneously, implementing 15 changes at once. Conversion rates actually decreased because the store became confusing and felt “pushy.”
Lesson: Implement changes gradually and test each one. More optimization isn’t always better optimization.
The Wrong Metric Focus
Another store focused solely on increasing page views and time on site, assuming more engagement meant more sales. They removed friction that guided customers toward purchase, and sales dropped despite higher engagement.
Lesson: Optimize for revenue-generating actions, not just engagement metrics. Some friction (like guiding customers toward checkout) is actually beneficial.
These real-world examples provide valuable lessons, but the ecommerce landscape continues evolving. Let’s explore the future trends that will shape friction detection and elimination strategies.
Future Trends in Customer Journey Analytics
Here you’ll discover emerging technologies and evolving customer expectations that will reshape how we detect and eliminate friction in the coming years.
The world of ecommerce and customer analytics is evolving rapidly. Understanding future trends helps you prepare for changes and potentially gain competitive advantages by adopting new technologies early.
Emerging Technologies
AI-Powered Friction Detection is becoming more sophisticated, using machine learning to identify subtle patterns that humans might miss. These systems can analyze thousands of customer interactions simultaneously and predict friction before it occurs.
Future AI systems will likely provide:
- Real-time friction alerts when customer behavior indicates confusion
- Automatic optimization suggestions based on successful patterns from similar stores
- Predictive friction modeling that prevents problems before they develop
Real-Time Personalization will reduce friction by adapting the shopping experience to individual customer preferences and behaviors instantly. Instead of showing the same store to everyone, each visitor will see a version optimized for their specific needs and friction points.
Voice Commerce Integration introduces new friction considerations. As voice shopping grows, stores will need to optimize for spoken queries and voice-guided shopping experiences.
Evolving Customer Expectations
Privacy-First Analytics approaches are becoming essential as customers become more privacy-conscious and regulations like GDPR and CCPA expand. Future friction analysis will need to provide insights while respecting customer privacy preferences.
Omnichannel Journey Consistency is increasingly important as customers expect seamless experiences across all touchpoints. Friction in one channel can impact perception and behavior in all channels.
Accessibility and Inclusive Design considerations are becoming standard requirements, not nice-to-have features. Friction for customers with disabilities often indicates broader usability issues that affect all customers.
Understanding these trends helps you prepare for the future, but the most important step is taking action today. Let’s wrap up with clear, actionable steps you can implement immediately.
Conclusion
In this final section, you’ll receive a clear action plan for implementing friction detection and elimination in your own Shopify store, plus key takeaways to guide your optimization efforts.
You’ve learned how to identify, analyze, and eliminate friction points that could be costing your Shopify store significant revenue. But knowledge without action doesn’t improve conversions. Here’s how to turn these insights into real results.
Key Takeaways for Shopify Merchants
Data-Driven Friction Elimination is Essential for competitive success. Guessing where problems might be is expensive and ineffective. Systematic analysis and testing provide reliable paths to improvement.
Small Changes Can Yield Big Results when applied to high-impact friction points. A simple checkout optimization or trust signal addition can increase revenue by 20-30% with minimal investment.
Customer Experience and Revenue Growth Go Hand-in-Hand. Reducing friction doesn’t just improve conversions – it creates happier customers who are more likely to return and recommend your store.
Continuous Optimization Beats Perfect Implementation. Start with basic friction detection and improve your approach over time. Consistent small improvements outperform sporadic major overhauls.
Action Plan for Implementation
Days 1-30: Foundation Setup
- Install Google Analytics 4 with enhanced ecommerce tracking
- Set up conversion tracking for key funnel stages
- Implement basic heatmap tracking on key pages
- Audit your current conversion funnel and identify obvious friction points
- Create customer personas based on your analytics data
Days 31-60: Analysis and Quick Wins
- Analyze your conversion funnel data to identify major drop-off points
- Implement 3-5 quick-win optimizations (trust badges, clear CTAs, shipping info)
- Set up A/B tests for your highest-impact friction points
- Gather customer feedback through surveys or support ticket analysis
- Create a priority matrix for additional optimization opportunities
Days 61-90: Advanced Implementation
- Run A/B tests on major friction points identified in your analysis
- Implement session recording to observe customer behavior patterns
- Optimize mobile experience based on device-specific friction data
- Set up ongoing monitoring and reporting cycles
- Plan longer-term optimization projects based on your priority matrix
Success Metrics and Review Schedule
Track conversion rate improvements, revenue per visitor, and customer satisfaction scores monthly. Review friction analysis quarterly to identify new opportunities and seasonal patterns.
Remember: every friction point you eliminate makes your store more profitable and your customers happier. Start with one small change today, measure the results, and build momentum from there.
Ready to turn your friction insights into increased sales? Consider how Growth Suite can help eliminate purchase hesitation by presenting time-limited, personalized offers to visitors who show signs of uncertainty. Its intelligent behavioral tracking and genuine urgency creation can help convert more browsers into buyers while maintaining your brand integrity.
References
- Shopify. (2024). “Effective Tactics for Customer Journey Optimization (2024).” Shopify Blog. Retrieved from https://www.shopify.com/blog/customer-journey-optimization
- ContentSquare. (2023). “How to Use Customer Journey Analytics to Eliminate Friction for Users.” Retrieved from https://contentsquare.com/blog/how-to-use-customer-journey-analytics-to-eliminate-friction-for-users/
- Shopify. (2024). “How To Create a Customer Journey Map + Template (2024).” Shopify Blog. Retrieved from https://www.shopify.com/blog/customer-journey-map
- MarketingLib. (2025). “Funnel Friction Points: Identifying & Eliminating Barriers to Conversion.” Retrieved from https://marketinglib.com/funnel-friction-points-identifying-eliminating-barriers-to-conversion/
- Howuku. (2023). “Customer Friction Points (2023): Comprehensive Guide for Digital Marketers.” Retrieved from https://howuku.com/blog/customer-friction-points