
Are you running a Shopify store but feel like you’re navigating in the dark? Do you wonder which products are really driving your sales or where your customers are coming from? If you’ve nodded yes, you’re not alone! Many store owners launch their online shops with great products but miss out on the secret ingredient to success: data.
Think of Google Analytics as your store’s personal detective – quietly collecting clues about your customers’ behavior that can transform your business decisions from guesswork into strategy. Did you know that stores using analytics effectively see up to 30% higher conversion rates than those flying blind?
By the end of this article, you’ll learn:
- How to set up Google Analytics for your Shopify store (even if you’re not tech-savvy)
- Which key metrics actually matter for your bottom line
- Practical ways to use data to boost your sales
- How to track customer journeys from first click to checkout
- Simple optimization strategies based on real insights
Ready to transform your store with the power of data? Let’s dive in!
Introduction to Google Analytics for Shopify
Google Analytics is a free web analytics tool that helps you understand exactly how visitors interact with your online store. For Shopify merchants, it’s like having x-ray vision into your business operations.
The numbers don’t lie: stores making data-driven decisions see an average revenue increase of 15-20% compared to competitors. With e-commerce competition growing fiercer every day, this advantage can make or break your business.
Recently, Google has evolved from Universal Analytics to Google Analytics 4 (GA4), bringing more powerful e-commerce tracking capabilities. This new version focuses on customer journeys across devices rather than just pageviews, giving you a more complete picture of how shoppers interact with your store.
The business benefits of implementing Google Analytics for your Shopify store include:
- Smarter inventory decisions based on product performance data
- More effective marketing spend by identifying which channels drive actual sales
- Improved customer experience by finding and fixing friction points
- Higher conversion rates through data-backed optimization
- Better understanding of customer behavior to inform business strategy
Throughout this article, we’ll explore the key metrics and insights that will help you transform raw data into actionable strategies. You’ll discover how to track everything from visitor demographics to shopping behavior, helping you make informed decisions that grow your business.
Now that you understand why Google Analytics is essential for your Shopify success, let’s look at how to set it up properly. After all, even the most powerful tool won’t help if it’s not installed correctly!
Setting Up Google Analytics for Your Shopify Store
Getting Google Analytics working with your Shopify store isn’t as complicated as it might seem. Let’s break it down into three manageable steps that anyone can follow, even without technical expertise.
Step 1: Creating a Google Analytics Account
First things first, you need to set up your Google Analytics account:
- Visit analytics.google.com and sign in with your Google account
- Click “Start measuring” to begin the setup process
- Enter your account name (your business name works well)
- On the next screen, create a property by entering your website name and selecting your time zone and currency
- Provide basic business information when prompted
- Accept the terms of service
Pro tip: When naming your account and property, use clear, consistent naming conventions. If you have multiple stores, consider including the store name and purpose in the property name (e.g., “Main Shopify Store – US Market”).
Step 2: Connecting Google Analytics to Shopify
Once your Analytics account is ready, it’s time to connect it to your Shopify store:
- In your Shopify admin panel, go to “Online Store” and then “Preferences”
- Look for the Google Analytics section
- If you’re using GA4 (recommended), paste your measurement ID (starts with “G-“) from your Google Analytics property settings
- Check the “Use Enhanced Ecommerce” box
- Click “Save”
For a more advanced setup, you can use Shopify’s Google & YouTube app, which allows for a deeper integration:
- Go to the Shopify App Store and install the “Google & YouTube” app
- Follow the connection steps in the app to link your Google Analytics account
- Grant the necessary permissions when prompted
Common connection issues: If you’re having trouble, check that you’re using the correct tracking ID format (GA4 uses a “G-” prefix). Also, remember that it can take up to 24 hours for data to start appearing in your reports.
Step 3: Enabling Enhanced E-commerce Tracking
Enhanced E-commerce tracking is what makes Google Analytics truly powerful for Shopify stores. It allows you to track the entire shopping journey, from product views to purchases:
- In Google Analytics, go to “Admin” > “E-commerce Settings” under the property column
- Toggle “Enable E-commerce” to ON
- Toggle “Enable Enhanced E-commerce Reporting” to ON
- Click “Save”
- In Shopify, make sure the “Use Enhanced Ecommerce” checkbox is selected in your Google Analytics settings
To verify your implementation is working correctly:
- Use Google Analytics’ Real-Time reports to see if your own visits are being tracked
- Make a test purchase on your store to confirm transaction data is coming through
- Check for e-commerce data in the “Conversions” > “E-commerce” section after 24-48 hours
With your tracking properly set up, you’re now ready to start exploring the wealth of data Google Analytics provides. But which metrics should you focus on? Let’s dive into the key reports that will give you the most valuable insights for your Shopify store.
Understanding Key Metrics and Reports
Now that your Google Analytics is connected to your Shopify store, let’s explore the four main categories of reports that will provide you with actionable insights. Think of these as different lenses through which you can view your business.
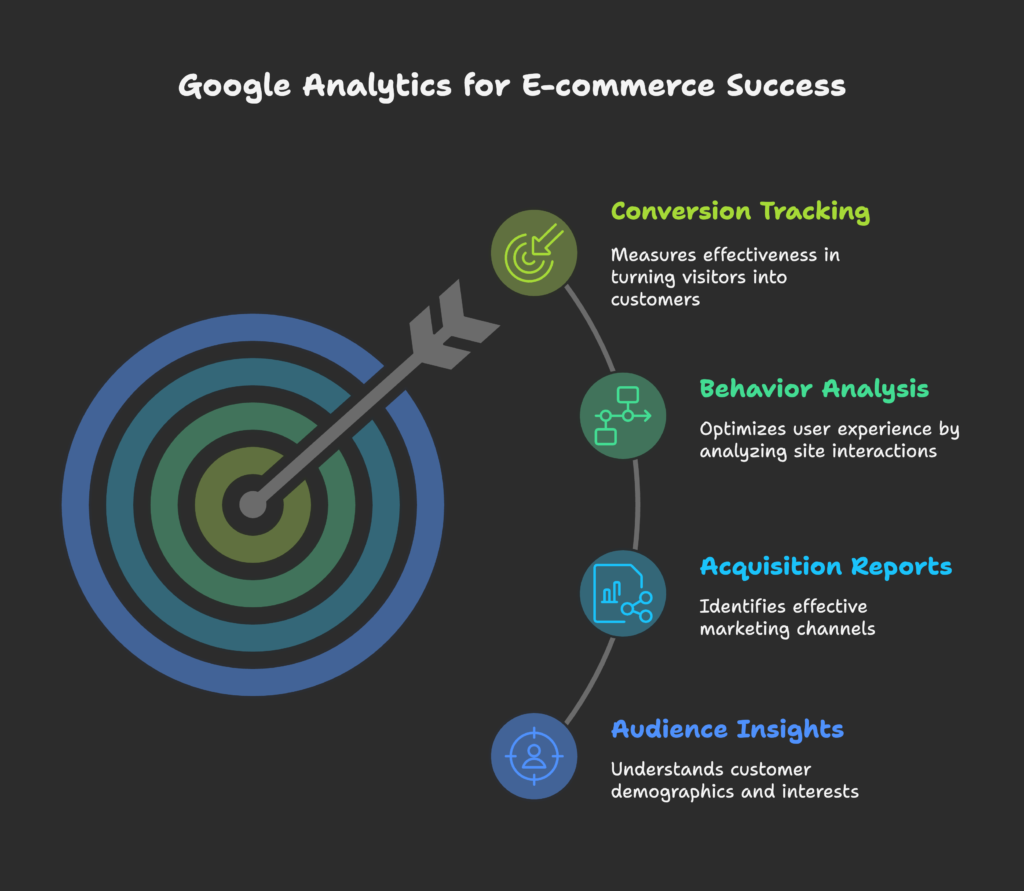
Audience Insights
The Audience section tells you who your customers are, which is crucial for targeting the right people with your marketing:
- Demographics: Age and gender breakdowns help you understand if your actual customers match your target audience. For example, if you’re marketing to young adults but your data shows mostly middle-aged customers, you might need to adjust your strategy.
- Interests: Google Analytics categorizes your visitors by their interests (like “Food Lovers” or “Technology Enthusiasts”), which can inspire new product ideas or marketing angles.
- Geographic information: Knowing where your customers live helps with international shipping decisions, localized marketing, and even inventory planning for seasonal products.
- Technology: Device and browser data shows how people access your store. If 70% of visitors use mobile but your conversion rate is much lower on mobile than desktop, that’s a clear sign your mobile experience needs improvement.
Segmentation strategy: Create audience segments based on these insights to compare how different customer groups behave. For example, you might discover that visitors from a particular city have a much higher conversion rate, which could inform targeted advertising.
Acquisition Reports
Acquisition reports reveal how visitors find your store, helping you invest in the most effective marketing channels:
- Traffic sources: See whether visitors come from social media, search engines, direct traffic, or referrals from other websites.
- Channel groupings: Compare performance across major marketing channels to see which delivers the highest quality traffic.
- Campaign tracking: By using UTM parameters in your marketing links (like email campaigns or social posts), you can track exactly which campaigns drive sales.
- Search Console integration: Connect Google Search Console to see which keywords bring organic traffic to your store.
Attribution models: GA4 offers different ways to credit sales to marketing touchpoints. The default “last click” model gives all credit to the final touchpoint before purchase, but “first click” or “position based” models might better reflect your customer journey.
Behavior Analysis
Behavior reports show what visitors do on your site, helping you optimize the user experience:
- Site content: Identify your most viewed pages and products, and see which pages have high exit rates (where people leave your site).
- Site speed: Page load time directly impacts conversion rates—a one-second delay can reduce conversions by 7%! Use these insights to prioritize speed optimizations.
- Event tracking: Monitor specific interactions like video plays, button clicks, or form completions to understand engagement at a granular level.
- Behavior flow: Visualize the paths users take through your site, identifying common journeys and potential roadblocks.
Key insight: Pay special attention to where visitors leave during the shopping process. A high exit rate on product pages might indicate missing information, while exits from the shipping page could suggest shipping costs are too high.
Conversion Tracking
Conversion reports reveal how effectively your store turns visitors into customers:
- Goal setup: Beyond purchases, set up goals for key actions like newsletter signups, account creations, or reaching specific high-value pages.
- E-commerce transactions: Track revenue, transaction count, and average order value over time and across different segments.
- Multi-channel funnels: See the complete path to purchase across multiple sessions and channels, revealing the true customer journey.
- Attribution modeling: Understand which touchpoints contribute most to conversions, helping you allocate marketing budget more effectively.
Now that you understand the four main categories of Google Analytics reports, it’s time to focus on the specific e-commerce metrics that will have the biggest impact on your Shopify store’s bottom line. After all, with so much data available, knowing what to prioritize is key to making effective decisions!
Essential E-commerce Metrics to Track
With so many numbers available in Google Analytics, it’s easy to get overwhelmed. Let’s focus on the metrics that directly impact your Shopify store’s success, organized into four key areas.
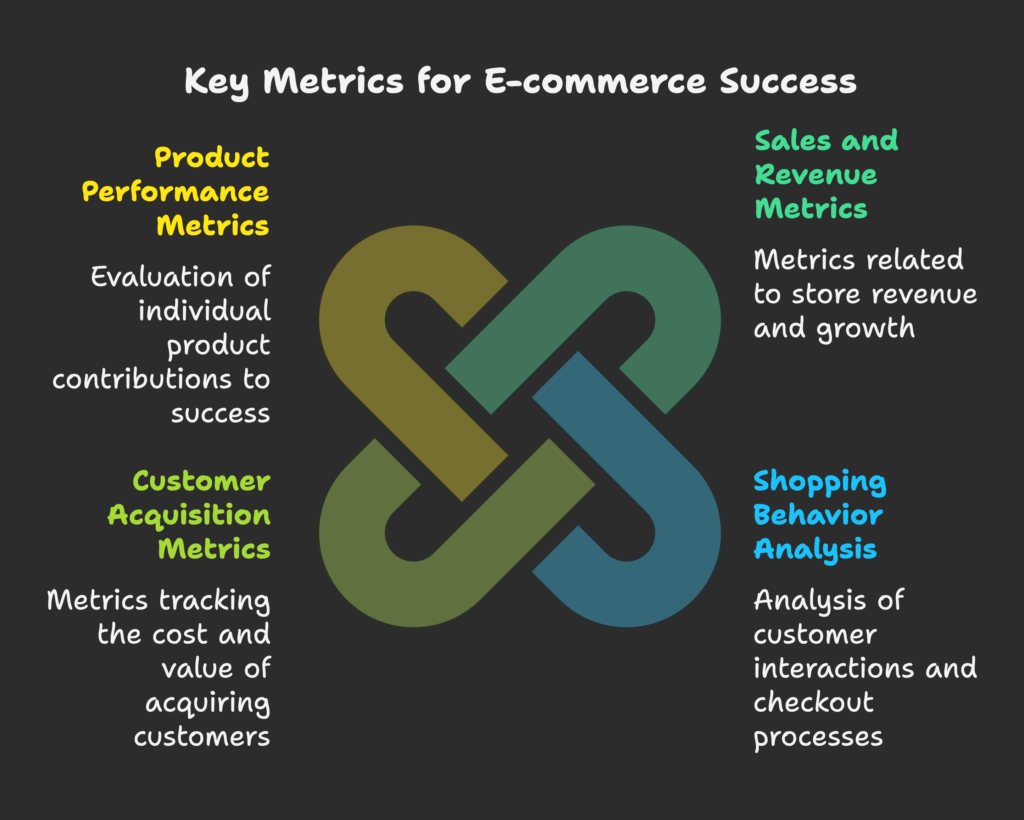
Sales and Revenue Metrics
These metrics tell you how much money your store is making and from what sources:
- Total revenue: Track this daily, weekly, and monthly to understand overall business health and growth patterns.
- Average Order Value (AOV): This shows how much customers typically spend in a single order. Increasing AOV by just 10% can significantly boost profits without requiring more traffic.
- Revenue by product category: Identify which product types drive the most revenue to inform inventory and marketing decisions.
- Revenue by SKU: Pinpoint your star performers and underperforming products at the individual item level.
- Seasonal trends: Analyze how sales fluctuate throughout the year to better prepare for peak periods and slow seasons.
Action tip: If you notice that certain products have much higher AOV, consider featuring them more prominently or creating bundles that include these items.
Shopping Behavior Analysis
These metrics reveal how customers interact with your products and checkout process:
- Shopping behavior funnel: See how many visitors view products, add to cart, begin checkout, and complete purchases.
- Checkout behavior: Track where customers abandon during the checkout process to identify friction points.
- Product list performance: Measure how effectively your category pages and collections convert visitors.
- Add-to-cart rate: Calculate what percentage of product views result in items being added to cart.
- Cart abandonment rate: Monitor the percentage of carts that never complete checkout—the e-commerce average is around 70%, so anything lower is good!
Quick win: If you notice a high abandonment rate between shipping information and payment, consider offering free shipping thresholds or being more transparent about all costs earlier in the process.
Customer Acquisition Metrics
These metrics help you understand the cost and value of gaining new customers:
- Cost Per Acquisition (CPA): Calculate how much you spend on marketing to acquire one customer by dividing marketing costs by new customers gained.
- New vs. returning customers: Track the balance between first-time and repeat purchasers—healthy stores typically see 20-30% return customers.
- Customer Lifetime Value (CLV): Estimate how much revenue a customer will generate over their entire relationship with your store.
- Acquisition source performance: Compare which channels bring in customers with the highest value and lowest acquisition cost.
Strategic insight: If your CLV is $200 and your CPA is $50, you’re in good shape with a 4:1 ratio. If the gap narrows too much, you need to either reduce acquisition costs or increase customer value through better retention.
Product Performance Metrics
These metrics show you how individual products contribute to your store’s success:
- Product conversion rate: Track what percentage of people who view a product end up purchasing it.
- Product page bounce rate: Measure how often visitors leave after viewing just one product page without further interaction.
- Product revenue share: Calculate what percentage of total revenue comes from each product.
- Product affinity: Identify which products are frequently purchased together to create effective bundle offers.
- Days of inventory: Cross-reference analytics data with inventory levels to optimize stock management.
Optimization opportunity: Products with high view counts but low conversion rates are prime candidates for page optimization—perhaps they need better images, more detailed descriptions, or customer reviews.
Now that you understand which metrics to track, let’s explore how to take your Google Analytics implementation to the next level with advanced features that give you even deeper insights into your Shopify store’s performance.
Advanced Google Analytics Implementation
Ready to go beyond the basics? These advanced techniques will help you extract even more valuable insights from Google Analytics and tailor it to your specific business needs.
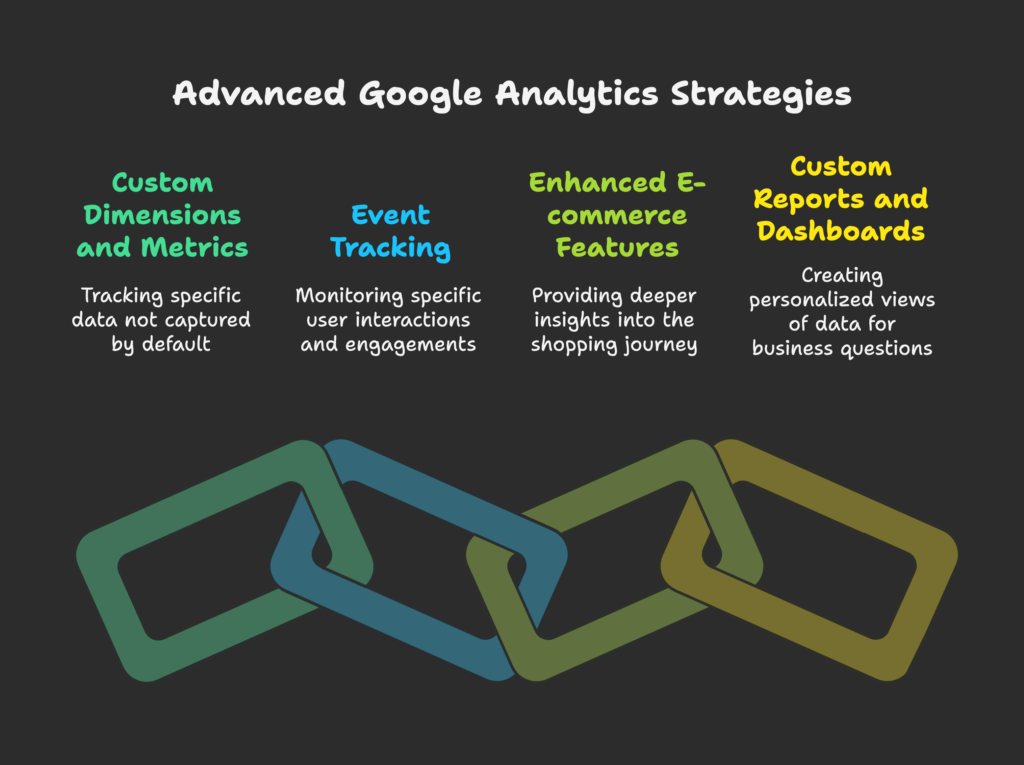
Custom Dimensions and Metrics
Custom dimensions and metrics allow you to track Shopify-specific data that Google Analytics doesn’t capture by default:
- Customer type dimension: Track whether purchases come from first-time or VIP customers.
- Shipping method dimension: Analyze how shipping choices impact conversion rates and average order value.
- Discount amount metric: Measure the impact of different discount levels on purchase behavior.
- Profit margin metric: Go beyond revenue to track actual profitability by product or category.
Implementation typically requires some custom code or a specialized Shopify app. The effort is worth it for the insights you’ll gain about your specific business questions.
Event Tracking
GA4’s event-based model makes it easier than ever to track specific user interactions:
- Essential e-commerce events: Beyond the standard pageviews, track events like “view_item,” “add_to_cart,” “begin_checkout,” and “purchase.”
- User engagement events: Monitor interactions like video plays, form submissions, and outbound link clicks.
- Custom store features: Track usage of size guides, color selectors, or product configurators.
- Error events: Identify when users encounter errors during checkout or other key processes.
To debug event tracking, use the real-time reports in Google Analytics to confirm events are firing correctly as you test them on your site.
Enhanced E-commerce Features
These specialized e-commerce tracking capabilities provide deeper insights into the shopping journey:
- Product impressions: Track which products customers see in listings, not just what they click on.
- Promotion impressions and clicks: Measure how effectively your banner ads and special offers drive engagement.
- Refund tracking: Monitor returns and refunds to identify problematic products or customer service issues.
- Coupon code performance: Analyze which discount codes drive the most revenue and which might be hurting your margins.
These features often require additional setup beyond the basic Shopify integration, but the detailed insights make the effort worthwhile.
Custom Reports and Dashboards
Create personalized views of your data to answer specific business questions:
- Custom reports: Combine dimensions and metrics that aren’t available in standard reports, such as comparing conversion rates across different product categories and acquisition channels simultaneously.
- Executive dashboards: Build simplified overviews with just the key metrics your team needs to monitor daily or weekly.
- Automated exports: Schedule regular reports to be delivered to your email or shared with team members.
- Visualization best practices: Use appropriate chart types for different metrics—line charts for trends over time, pie charts for showing composition, and bar charts for comparisons.
Time-saving tip: Create separate dashboards for different roles in your organization—marketing team, product team, and executive overview—focusing on just the metrics each group needs.
With these advanced implementations in place, your analytics setup will provide deeper insights that give you a competitive edge. But what about the growing portion of your customers who shop on mobile devices? That’s what we’ll explore next.
Mobile Analytics for Shopify
With over 70% of e-commerce traffic now coming from mobile devices, understanding your mobile customers is crucial for Shopify success. Let’s look at how to use Google Analytics to optimize the mobile shopping experience.
Mobile Performance Analysis
Start by comparing how mobile users behave differently from desktop users:
- Device comparison: Use the “Device Category” dimension to compare conversion rates, bounce rates, and average order value across mobile, tablet, and desktop.
- Mobile-specific metrics: Pay special attention to mobile page load times, as mobile users are even less patient than desktop users.
- Operating system and browser: Check if performance varies between iOS and Android users, or across different mobile browsers.
- Screen resolution: Ensure your site performs well across various screen sizes by analyzing user data by device screen resolution.
Common finding: Many stores discover their mobile conversion rate is half their desktop rate despite having more mobile traffic. This conversion gap represents one of the biggest opportunities for growth.
App vs. Mobile Web Analysis
If you have a Shopify store app alongside your mobile website, compare their performance:
- User engagement differences: App users typically have longer sessions and view more products than mobile web users.
- Conversion rate comparison: Apps often convert at 1.5-2x the rate of mobile websites due to faster performance and saved user information.
- Cross-device tracking: Use Google’s User ID feature to track customers across app and web experiences for a unified view.
- Push notification effectiveness: If your app uses push notifications, track their open rates and conversion impact.
Strategic consideration: If your data shows significantly better performance in your app, consider offering app-exclusive discounts or features to encourage downloads.
Mobile optimization is just one part of improving your overall conversion rate. Next, let’s look at how to use Google Analytics data to systematically increase the percentage of visitors who become customers.
Conversion Optimization Strategies
Improving your conversion rate is often the fastest way to increase revenue without spending more on marketing. Let’s explore how to use Google Analytics to identify and fix conversion barriers.
Conversion Funnel Analysis
The funnel visualization shows where customers drop off in the path to purchase:
- Funnel setup: In GA4, create a new funnel exploration report using key events like view_item > add_to_cart > begin_checkout > purchase.
- Identifying drop-off points: Look for steps with the biggest percentage decreases—these are your priority areas for improvement.
- Segment comparison: Compare funnel completion rates across different customer segments (new vs. returning, mobile vs. desktop) to find specific problems.
- A/B testing: Use these insights to develop hypotheses for testing changes to problematic areas of your site.
Example insight: If you notice a 70% drop-off between “begin_checkout” and “shipping_info” for mobile users specifically, you might test a simplified mobile checkout form.
Cart Abandonment Analysis
With average cart abandonment rates around 70%, reducing abandonment can significantly boost sales:
- Abandonment tracking: Set up events to track when users add items to cart but leave without purchasing.
- Abandonment by product: Identify if certain products have higher abandonment rates, which might indicate pricing or description issues.
- Abandonment by traffic source: Determine if visitors from certain channels are more likely to abandon carts.
- Recovery strategies: Use insights to implement targeted interventions like exit-intent popups with discounts or email recovery campaigns.
Quick win: If analysis shows price sensitivity is causing abandonment, test offering free shipping with a minimum order value that’s slightly above your current average order value.
Checkout Optimization
The checkout process is where you convert interested shoppers into paying customers:
- Checkout steps analysis: Track progress through each checkout step to identify where friction occurs.
- Form field friction: Look for patterns in form completion time or error rates that might indicate confusing fields.
- Payment method analysis: Compare conversion rates across different payment options to ensure you’re offering preferred methods.
- Shipping impact: Analyze how different shipping options and costs affect completion rates.
Case study: One Shopify store increased conversions by 15% simply by reordering checkout fields based on analytics data showing where users were getting stuck.
Now that we’ve explored how to optimize your conversion path, let’s look at how Google Analytics can help you evaluate and improve your marketing efforts.
Marketing Channel Effectiveness
Not all traffic is created equal. Using Google Analytics, you can identify which marketing channels deliver the best return on investment for your Shopify store.
Channel Performance Comparison
Evaluate each marketing channel based on more than just traffic volume:
- Multi-channel attribution: Move beyond last-click attribution to understand how channels work together. For example, social media might introduce customers who later convert through search.
- Return on Ad Spend (ROAS): Calculate how much revenue each paid channel generates per dollar spent—aim for at least 3:1 for sustainable growth.
- Assisted conversions: Identify channels that may not directly lead to sales but play an important role earlier in the customer journey.
- Channel-specific metrics: Compare bounce rate, average session duration, pages per session, and conversion rate across channels to understand quality differences.
Data-driven decision: If email marketing shows a 10x higher ROAS than paid social, the logical next step is to invest more in growing your email list and less in social ads.
Campaign Tracking
UTM parameters allow you to track specific marketing initiatives beyond just the channel level:
- UTM implementation: Add parameters to your campaign links: utm_source (where the link appears), utm_medium (marketing method), utm_campaign (specific promotion name), utm_content (specific link identifier).
- Campaign comparison: Compare different email subjects, ad creatives, or promotional offers to see which drives the most revenue.
- A/B testing analysis: Use campaign data to evaluate split tests and determine winning variations.
- Seasonal performance: Track how campaign effectiveness changes during different seasons or promotional periods.
Pro tip: Create a consistent UTM naming convention and share it with your team to ensure clean, usable data. Consider using a UTM building tool to maintain consistency.
Social Media Impact Assessment
Social media’s influence often extends beyond direct conversions:
- Social traffic quality: Compare engagement metrics and conversion rates across different social platforms.
- Social interaction tracking: Set up events to track shares, likes, and comments to measure engagement beyond just traffic.
- Social campaign ROI: Calculate the return on investment for both organic content and paid social campaigns.
- Platform-specific analysis: Determine which content types perform best on each social network to tailor your approach.
Insight example: You might discover that Instagram drives less traffic than Facebook but has a 2x higher conversion rate, suggesting you should focus more on quality Instagram content.
Understanding your marketing effectiveness is crucial, but don’t forget about technical factors that can make or break the user experience. Let’s see how Google Analytics can help identify technical improvements to boost performance.
Technical Optimization Insights
Technical issues can silently kill your conversion rates. Let’s explore how Google Analytics can help you identify and fix these hidden problems.
Site Speed Analysis
Page speed directly impacts your bottom line—research shows a one-second delay in page load time can reduce conversions by 7%:
- Page timing metrics: Review “Site Speed” reports to identify your slowest pages that need optimization.
- Speed by device: Compare load times across mobile and desktop to ensure all users have a good experience.
- Speed by browser: Identify if specific browsers show significantly worse performance.
- Connection speed: Check if users on slower connections have substantially worse experiences that might be improved with optimizations.
Priority fix: Focus first on speeding up your most visited pages and critical conversion points like product pages and checkout—these improvements will have the biggest revenue impact.
User Experience Optimization
Analytics can reveal UX problems that might not be obvious through direct observation:
- Behavior flow analysis: Look for unexpected paths or loops in user journeys that indicate confusion.
- Exit page analysis: Pages with high exit rates (outside of order confirmation) may have usability issues or missing information.
- Session duration patterns: Unusually short sessions might indicate unclear navigation or poor first impressions.
- Content engagement: Low time-on-page for key content could suggest readability problems or irrelevant information.
UX insight: If your product pages have high exit rates but low average time on page, customers might be leaving because they can’t quickly find the information they need—consider reorganizing product details to put the most important information first.
With technical optimizations in place, your store will perform better and provide data more accurately. Now, let’s explore how to enhance your analytics by connecting Google Analytics with other tools in your e-commerce stack.
Integrating Google Analytics with Other Tools
Google Analytics becomes even more powerful when connected to other tools in your e-commerce ecosystem. Let’s explore the most valuable integrations for your Shopify store.
Shopify Reports Integration
While Google Analytics provides comprehensive data, Shopify’s native reports offer complementary insights:
- Strengths of Shopify reports: More accurate order and revenue data, better inventory tracking, and simpler reporting for beginners.
- Strengths of Google Analytics: Better visitor behavior insights, more powerful segmentation, and cross-channel attribution.
- Data reconciliation: Understand that differences between the two systems are normal due to how they track users and attribute sales.
- Complementary use: Use Shopify for order and inventory management insights, and Google Analytics for customer journey and marketing performance.
Practical approach: Create a simple spreadsheet that pulls key metrics from both platforms for a comprehensive weekly or monthly business review.
Google Ads Integration
Linking Google Analytics to Google Ads creates a powerful feedback loop for optimizing your ad spend:
- Account linking: Connect your Google Ads and Analytics accounts in the Admin section of Analytics under “Product Links”.
- Enhanced campaign analysis: See post-click behavior for each campaign, ad group, and keyword to identify which drive actual revenue, not just clicks.
- Remarketing audiences: Create custom audiences based on website behavior (like cart abandoners) for targeted ad campaigns.
- Conversion import: Send Analytics conversion data back to Google Ads for smarter bidding strategies.
Optimization tip: Focus on cost per conversion rather than cost per click—a $2 click that converts at 5% is better than a $0.50 click that converts at 0.5%.
Third-Party Tool Integration
Expand your analytics capabilities by connecting with specialized tools:
- Email marketing platforms: Integrate with tools like Klaviyo or Mailchimp to track email campaign performance all the way through to purchase.
- CRM systems: Connect customer relationship management tools to combine online behavior with customer service data.
- Heat mapping tools: Use solutions like Hotjar alongside Google Analytics to visualize exactly how users interact with your pages.
- Data warehouse solutions: For larger stores, consider connecting Analytics to a data warehouse like BigQuery for deeper custom analysis.
Integration strategy: Start with the tools that address your biggest current business questions or challenges rather than trying to integrate everything at once.
As you collect more customer data through these integrated tools, it’s important to consider privacy regulations and consumer concerns. Let’s examine how to maintain compliance while still gathering valuable insights.
Data Privacy and Compliance
With increasing privacy regulations worldwide, handling customer data properly is not just good practice—it’s the law. Here’s how to ensure your Google Analytics implementation respects privacy while still providing valuable insights.
GDPR and CCPA Considerations
The European General Data Protection Regulation (GDPR) and California Consumer Privacy Act (CCPA) impact how you collect and use analytics data:
- Impact on analytics: These regulations require user consent before tracking and give users rights to access or delete their data.
- IP anonymization: Enable this feature in Google Analytics to avoid storing full IP addresses.
- Data retention settings: Review and adjust how long Google Analytics stores user-level data in your account settings.
- Privacy policy updates: Ensure your store’s privacy policy clearly explains what data you collect and how you use it.
Compliance tip: Document your data handling processes and be prepared to respond to customer data requests within the required timeframes (30 days for GDPR, 45 days for CCPA).
Cookie Consent Management
Cookie consent is a key requirement for analytics in many jurisdictions:
- Consent mechanisms: Implement a cookie banner that allows visitors to accept or decline tracking cookies before they’re set.
- Consent before tracking: Ensure Google Analytics doesn’t load until after consent is given (if required in your target markets).
- Tiered consent options: Consider offering users choices between necessary, functional, and marketing cookies.
- Maintaining data quality: Be aware that consent requirements may reduce your data completeness, so factor this into your analysis.
Balanced approach: Design your consent mechanism to be user-friendly while compliant—excessive friction can dramatically reduce opt-in rates and skew your data.
Now that we’ve covered both the technical setup and compliance considerations, let’s look at real-world examples of how Shopify stores have used Google Analytics to drive significant improvements.
Case Studies and Examples
Learning from others’ successes can inspire your own analytics strategy. Let’s explore some real-world examples of how Shopify stores have used Google Analytics to solve problems and grow their businesses.
Successful Analytics Implementation
Case Study 1: Reducing Cart Abandonment
A fashion retailer noticed their cart abandonment rate was 78%, higher than the industry average. Using Google Analytics, they discovered:
- Mobile users were abandoning at a 25% higher rate than desktop users
- The shipping information page had the highest drop-off
- Users who abandoned spent an average of only 15 seconds on the shipping page
Their solution? They simplified the mobile checkout, added shipping cost estimates earlier in the process, and implemented a progress indicator. The result was a 15% decrease in cart abandonment, leading to a $50,000 monthly revenue increase.
Case Study 2: Optimizing Marketing Spend
A home goods store was spending equally across Google, Facebook, and Instagram ads. Their Google Analytics data revealed:
- Google Ads had a 4.5x return on ad spend
- Facebook was at 2.2x ROAS
- Instagram was only 1.3x ROAS but was bringing in younger customers with higher lifetime value
They reallocated their budget: 60% to Google, 25% to Facebook, and 15% to Instagram (focusing only on high-performing ad types). This strategic shift resulted in a 35% increase in overall ROAS and 22% revenue growth.
Industry-Specific Analytics Approaches
Different types of Shopify stores should focus on different metrics and strategies:
Fashion and Apparel
- Key metrics: Size and color variant performance, return rates by product type, seasonal trends
- Analytics focus: Mobile user experience, social media attribution, and visual merchandising effectiveness
Food and Beverage
- Key metrics: Repeat purchase rate, time between orders, average items per order
- Analytics focus: Subscription conversion paths, shipping time impact on reorders, and product bundling effectiveness
Home Goods and Furniture
- Key metrics: Research time before purchase, comparison shopping behavior, financing option usage
- Analytics focus: Long consideration journeys, cross-device shopping patterns, and financing funnel optimization
Digital Products
- Key metrics: Demo-to-purchase conversion, content engagement before purchase, license renewal rates
- Analytics focus: Content effectiveness, trial conversions, and upgrade paths
With these case studies and industry-specific approaches in mind, let’s look ahead to the future of e-commerce analytics and how you can prepare your Shopify store for coming changes.
Future Trends in E-commerce Analytics
The world of e-commerce analytics is evolving rapidly. Understanding these trends will help you stay ahead of the competition and prepare your Shopify store for the future.
Emerging Analytics Technologies
Several technological advancements are reshaping how we collect and use customer data:
- AI-powered insights: Google Analytics is increasingly using machine learning to automatically detect anomalies and opportunities in your data.
- Predictive analytics: Beyond showing what happened, analytics tools are getting better at predicting what will happen—like which customers are likely to purchase or churn.
- Customer journey orchestration: Advanced systems can now personalize experiences across touchpoints based on analytics data.
- Voice analytics: As voice shopping grows, new metrics around voice searches and commands will become important.
Adoption strategy: Start experimenting with predictive features in Google Analytics 4 now, such as the “Predictive Audiences” that identify users likely to purchase or churn based on their behavior patterns.
Privacy-First Analytics
As third-party cookies phase out and privacy regulations increase, analytics is undergoing a fundamental shift:
- Server-side tracking: Moving analytics processing to servers rather than browsers can improve data accuracy while respecting privacy.
- Cookieless tracking methods: New techniques like Google’s Privacy Sandbox aim to provide insights without individual tracking.
- First-party data strategy: Collecting data directly from your customers (with consent) will become increasingly valuable.
- Aggregated and anonymized data: Analytics will shift toward analyzing patterns in larger user groups rather than individual behaviors.
Future-proofing tip: Start building your first-party data assets now by encouraging account creation, newsletter signups, and other consensual data collection that doesn’t rely on third-party cookies.
Now that you understand both current best practices and future trends, let’s create a practical implementation plan to get your Shopify store’s analytics on track.
Implementation Guide
Ready to transform your Shopify store with data-driven decisions? This practical implementation guide will help you get started with Google Analytics in a systematic way.
Step-by-Step Implementation Plan
Follow this roadmap to set up and optimize your analytics:
- Week 1: Setup and Verification
- Create your Google Analytics 4 property
- Connect to your Shopify store
- Enable enhanced e-commerce tracking
- Verify that data is flowing correctly
- Week 2-3: Basic Monitoring and Learning
- Set up basic dashboards for key metrics
- Create goals for important conversions
- Begin monitoring fundamental metrics daily
- Learn the analytics interface and reports
- Month 2: Marketing Channel Analysis
- Implement UTM parameters for all marketing campaigns
- Connect Google Ads and other available integrations
- Analyze channel performance and adjust spending
- Set up campaign dashboards
- Month 3: Conversion Optimization
- Analyze conversion funnels for drop-off points
- Implement event tracking for key user interactions
- Create hypotheses for improving problem areas
- Begin A/B testing based on analytics insights
- Month 4-6: Advanced Implementation
- Set up custom dimensions and metrics
- Create more sophisticated reports and dashboards
- Implement enhanced e-commerce features
- Begin predictive analytics exploration
Resource allocation tip: For small stores, plan to spend 2-3 hours per week on analytics. Larger stores should consider dedicating a team member part-time or full-time to data analysis.
Tools and Resources
These supplementary tools and resources will help you get the most from your analytics implementation:
- Analytics enhancement tools:
- Google Tag Manager – for more advanced tracking implementation
- Hotjar or Lucky Orange – for heat mapping and session recording
- Supermetrics – for automated reporting and dashboard creation
- Learning resources:
- Google Analytics Academy – free courses from beginner to advanced
- Google Merchandise Store demo account – practice with real data
- Shopify’s own analytics documentation
- Community support:
- Shopify Community forums
- Google Analytics solutions gallery for report templates
- Industry-specific e-commerce groups on Facebook and LinkedIn
With this implementation plan and these resources, you’re well-equipped to transform your Shopify store with the power of analytics. Let’s wrap up with some final thoughts.
Conclusion
Implementing Google Analytics for your Shopify store isn’t just about collecting data—it’s about transforming that data into insights and those insights into actions that grow your business. As we’ve explored throughout this guide, the benefits are substantial:
- More effective marketing spend through channel and campaign analysis
- Higher conversion rates through data-driven optimization
- Better inventory management based on product performance
- Enhanced customer understanding leading to improved experiences
- Competitive advantage in an increasingly data-driven market
Remember that analytics is not a one-time setup but a continuous process of measuring, analyzing, and improving. The most successful Shopify stores treat data analysis as an ongoing practice, regularly revisiting their metrics and adjusting their strategies accordingly.
Start with the basics, focus on the metrics that matter most for your specific business, and gradually implement more advanced features as you grow more comfortable with the platform. Even small data-driven improvements can compound over time into significant business growth.
By following the implementation guide in this article, you’re not just setting up a tracking tool—you’re establishing a competitive advantage that will help your Shopify store thrive in the increasingly competitive e-commerce landscape.
Remember: Looking to take your Shopify store to the next level? Consider using the Growth Suite app to boost your sales even further. This powerful tool works alongside Google Analytics to help you implement personalization, optimize your product recommendations, and automate marketing campaigns based on customer behavior data.
References
- Instant. (2025, February 26). Understanding the Shopify Google Analytics integration.
https://instant.so/blog/understanding-the-shopify-google-analytics-integration - weDevs. (2025, February 5). Google Analytics eCommerce Tracking for More Sales.
https://wedevs.com/blog/401785/google-analytics-ecommerce-tracking-tips/ - Coalition Technologies. Google Analytics for Shopify Stores: A Complete Guide.
https://coalitiontechnologies.com/blog/google-analytics-for-shopify-stores-a-complete-guide - Shopify Blog. (2024, January 2). 20 Key Ecommerce Metrics To Track In 2024.
https://www.shopify.com/blog/basic-ecommerce-metrics - OuterBox. (2024, June 10). Essential Google Analytics Metrics for Ecommerce Brands.
https://www.outerboxdesign.com/uncategorized/google-analytics-metrics-for-ecommerce - Gelato. 8 Top ways to use Google Analytics for ecommerce.
https://www.gelato.com/blog/google-analytics-for-ecommerce - Metric Labs. GA4 Shopify Ecommerce Tracking.
https://metriclabs.com.au/shopify-ga4-ecommerce-tracking/ - Elevar. (2022, April 1). Google Analytics for Shopify: Best Practice Implementation.
https://getelevar.com/analytics/google-analytics-for-shopify/ - StoreYa. Everything Shopify Stores Need to Know About Google Analytics.
https://blog.storeya.com/2024/08/shopify-google-analytics/ - Coupler.io Blog. (2025, February 14). Shopify Analytics: a Guide to Analyzing Data for E-commerce Success.
https://blog.coupler.io/shopify-analytics/ - Shopify Blog. (2023, March 6). Google Analytics for Ecommerce in 2024 (Complete Guide).
https://www.shopify.com/blog/14681601-google-analytics-for-ecommerce-a-beginners-guide