
Think about it: would you rather make business decisions based on guesswork or solid data that shows exactly what’s working (and what’s not)? Studies show that businesses making data-driven decisions are 23% more profitable than those who don’t. That’s a huge advantage in today’s competitive e-commerce world!
In this guide, you’ll learn:
- How to navigate the Shopify Analytics Dashboard like a pro
- Which key metrics actually matter for your business growth
- Simple ways to analyze customer behavior and improve sales
- Practical strategies to turn data insights into action
So grab a coffee, open your Shopify admin panel, and let’s transform you from a data-confused store owner to a confident, analytics-savvy entrepreneur!
Introduction to Shopify Analytics Dashboard
The Shopify Analytics Dashboard is your business command center—a place where all your store’s performance data comes together in one easy-to-understand view. Think of it as the control panel that helps you steer your e-commerce ship in the right direction.
At its core, Shopify Analytics gives you insights into:
- Who your customers are and how they shop
- Which products are selling and which aren’t
- Where your traffic comes from
- How effectively your store converts visitors into buyers
Why does this matter? Because when you understand these patterns, you can make informed decisions rather than just hoping for the best. For example, knowing that your conversion rate from mobile devices is 40% lower than desktop might lead you to improve your mobile shopping experience—potentially unlocking thousands in additional revenue.
According to recent e-commerce studies, businesses that regularly use their analytics data see an average 30% increase in revenue compared to those who rarely check their numbers. That’s like getting an extra month of sales each year just by paying attention to the right metrics!
But here’s the exciting part—you don’t need to become a data analyst to benefit from Shopify Analytics. The dashboard is designed to be user-friendly, with visual charts and straightforward metrics that anyone can understand with a little guidance. And that’s exactly what we’re going to provide in this article.
Now that you understand why analytics matters so much, let’s dive into how you can actually access and navigate this powerful tool. Are you ready to uncover the hidden insights in your store data? Let’s get started!
Accessing and Navigating the Shopify Analytics Dashboard
Before you can use the power of analytics, you need to know how to find and navigate the dashboard. Let’s break this down into simple steps so you can start exploring your data right away.
Accessing the Dashboard
Finding your analytics in Shopify is straightforward:
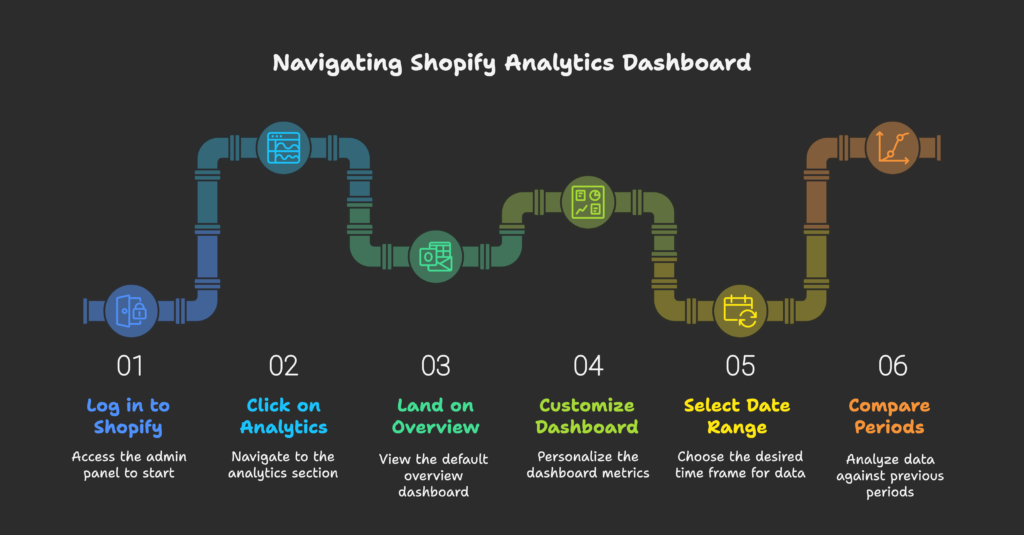
- Log in to your Shopify admin panel
- Click on “Analytics” in the left sidebar
- You’ll land on the “Overview” dashboard by default
When you first arrive, you’ll see a snapshot of your store’s performance over the last 7 days. This includes total sales, orders, and visitor information at a glance.
If you manage a team, it’s worth noting that access to analytics requires proper permissions. To give team members access:
- Go to “Settings” then “Users and permissions”
- Select the staff member and edit their permissions
- Ensure they have “View reports” permission enabled
Dashboard Customization
One of the best features of Shopify Analytics is that you can customize it to show exactly what matters to your business:
To personalize your dashboard:
- Click “Customize” at the top right of the Overview dashboard
- You’ll see options to add, remove, or rearrange metric cards
- Browse the metrics library to find relevant data points for your business
The metrics are organized into categories like Sales, Orders, Visitors, Behavior, Marketing, and more. A good starting point is to include:
- Total sales
- Average order value
- Conversion rate
- Top products by units sold
- Returning customer rate
Pro tip: Avoid cluttering your dashboard with too many metrics. Focus on 5-7 key numbers that directly impact your business decisions. You can always dive deeper when needed!
Date Range Selection and Comparison
Context is everything in analytics. A single number doesn’t tell you much, but comparing it to previous periods reveals the real story:
- Use the date selector in the top right to change your time frame
- Click “Compare” to enable period comparison
- Choose between “Previous period” or “Same period last year”
When analyzing trends, think about seasonality. Comparing December sales to November might show growth, but is that because of your marketing efforts or just holiday shopping patterns? Comparing to the previous December gives you a more accurate picture.
Smart date comparisons to try:
- Week-over-week for recent marketing campaigns
- Month-over-month for broader business trends
- Year-over-year for long-term growth assessment
- Before/after major website changes or product launches
Now that you can find your way around the dashboard, let’s talk about what you should actually be looking at. Ready to dive into the sales metrics that directly impact your bottom line? These numbers are where the rubber meets the road for your Shopify store!
Essential Sales Metrics
Sales metrics are the heartbeat of your e-commerce business. They tell you not just how much money you’re making, but how you’re making it. Let’s explore the most important ones to watch.
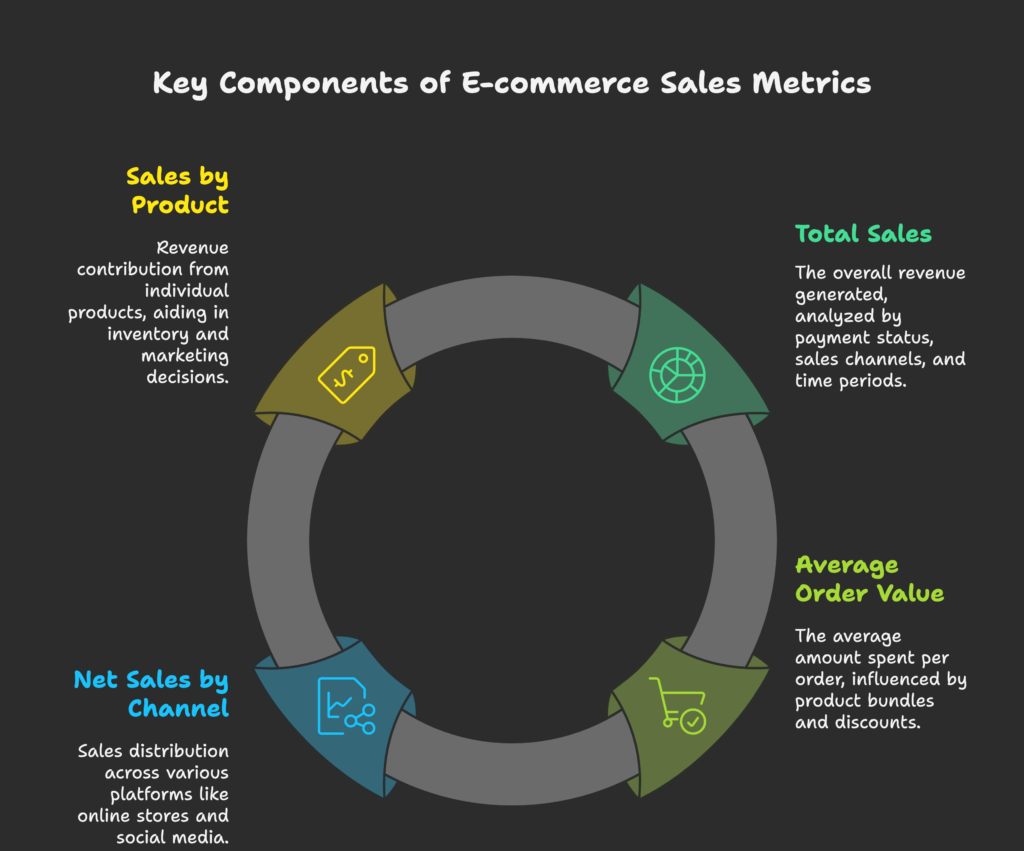
Total Sales
Total sales is the most straightforward metric—it’s the sum of all revenue your store generates. But there’s more to it than just a single number:
In Shopify Analytics, you can break down your total sales by:
- Payment status (paid, pending, refunded)
- Sales channels (online store, POS, social media integrations)
- Time periods (daily, weekly, monthly trends)
When analyzing your total sales, look for patterns like:
- Day-of-week effects (Are weekends stronger? Do Monday newsletters drive sales?)
- Response to promotions (How much lift did your last campaign create?)
- Seasonal fluctuations (Beyond holiday spikes, does your product have natural seasonality?)
To improve your total sales, focus on strategies that either increase traffic, conversion rate, or average order value (more on this next). A 10% improvement in each of these would compound to a 33% sales increase!
Average Order Value (AOV)
Average Order Value tells you how much customers typically spend per order. This is calculated by dividing total revenue by number of orders.
Why AOV matters: Increasing your AOV directly improves profitability because:
- The cost of acquiring a customer remains the same
- Shipping and handling costs don’t increase proportionally
- Processing fees have better economies of scale
Effective strategies to improve AOV include:
- Product bundles that offer slight discounts for multiple items
- Free shipping thresholds just above your current AOV (If your AOV is $45, offer free shipping at $60)
- Upsells and cross-sells that suggest complementary products
- Volume discounts that incentivize larger purchases
Track your AOV alongside marketing campaigns. Different traffic sources often produce different AOV—Google Shopping customers might spend more per order than Instagram followers, informing where to focus your advertising budget.
Net Sales by Channel
Modern e-commerce isn’t just about your website—it’s about selling wherever your customers prefer to shop:
Common sales channels include:
- Your Shopify online store
- Social media (Facebook, Instagram shops)
- Marketplaces (Amazon, eBay integration)
- Point of Sale (if you have physical locations)
- Buy buttons embedded on other websites or blogs
By analyzing channel performance, you can:
- Identify your most profitable sales avenues
- Spot underperforming channels that need optimization
- Make informed decisions about where to expand next
Don’t spread yourself too thin across channels. The data might show that 80% of your profits come from just two channels—focus on optimizing those before expanding to new ones.
Sales by Product
Not all products contribute equally to your bottom line. The “Sales by product” report helps you understand:
- Which items drive the most revenue
- Which products are most frequently purchased together
- How product performance changes over time
Smart ways to use product sales data:
- Inventory management: Stock more of your top sellers, less of slow movers
- Marketing focus: Feature high-margin products in your campaigns
- Product development: Create new items similar to your bestsellers
- Bundle creation: Package frequently co-purchased items together
Look for “hidden gems” in your product data—items with high margins and good conversion rates but low visibility. These might deserve more prominent placement on your homepage or in marketing materials.
Sales metrics tell you what’s happening now, but to build sustainable growth, you need to understand the people behind those purchases. Are you curious about what makes your customers tick? Let’s explore how customer behavior metrics can give you those insights!
Customer Behavior Metrics
Understanding who your customers are and how they interact with your store is just as important as tracking sales. These insights help you build relationships that go beyond one-time purchases.
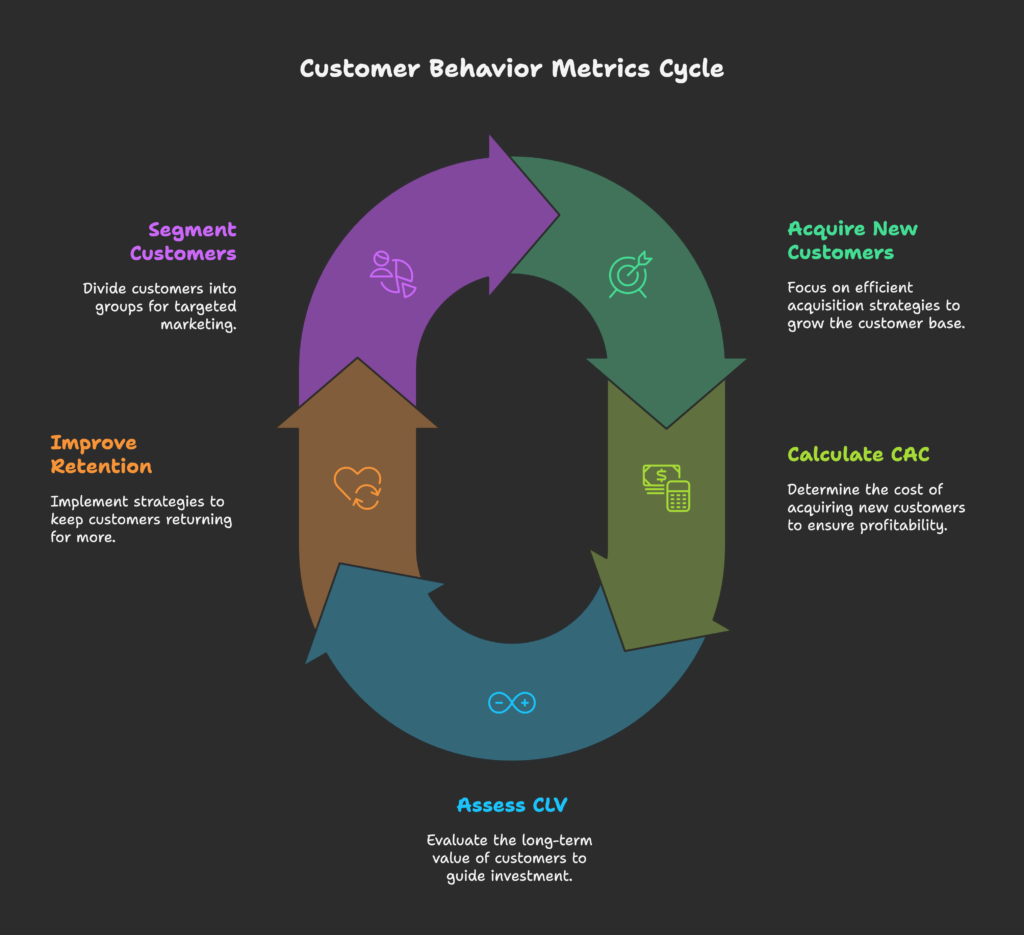
Customer Acquisition
New customer acquisition is the lifeblood of growth. In Shopify Analytics, you can track:
- New vs. returning customer counts
- First-time purchase conversion rates
- Traffic sources that bring new customers
A key metric to calculate is your Customer Acquisition Cost (CAC):
CAC = Total Marketing Costs ÷ Number of New Customers
For a healthy business, your customer acquisition cost should be significantly lower than their lifetime value (which we’ll discuss next). If you’re spending $50 to acquire customers who typically only spend $45 total with your brand, you’re losing money with each new purchase.
To improve acquisition efficiency:
- Optimize your highest-converting traffic sources
- Create targeted ads for your ideal customer persona
- Simplify the purchase process for first-time buyers
- Test different landing pages for new visitors
Customer Lifetime Value (CLV)
Customer Lifetime Value represents the total revenue you can expect from a customer throughout their relationship with your store. It’s calculated as:
CLV = Average Order Value × Purchase Frequency × Average Customer Lifespan
Why CLV matters: It shows the long-term value of customer relationships and helps determine how much you can afford to spend on acquisition.
In Shopify Analytics, examine:
- Purchase frequency patterns
- Time between orders
- Changes in spending over the customer relationship
Strategies to increase CLV include:
- Loyalty programs that reward repeat purchases
- Email marketing with personalized recommendations
- Subscription options for consumable products
- Outstanding customer service that builds trust and loyalty
Remember: Acquiring a new customer costs 5-25 times more than retaining an existing one, so investing in CLV improvement often yields better ROI than focusing solely on acquisition.
Returning Customer Rate
Your returning customer rate shows what percentage of your customer base comes back to make additional purchases. It’s a direct indicator of customer satisfaction and loyalty.
In Shopify, find this metric on the Customers report or add it to your custom dashboard. A healthy returning customer rate varies by industry but typically ranges from 20-40% for e-commerce.
To improve your returning customer rate:
- Implement post-purchase follow-ups
- Create special offers for previous customers
- Develop a clear email re-engagement strategy
- Focus on product quality and customer service
When analyzing this metric, segment by:
- Initial purchase amount (Do big spenders return more often?)
- First product purchased (Do certain products lead to higher retention?)
- Acquisition source (Do customers from certain channels show more loyalty?)
Customer Segmentation
Not all customers are the same, and segmentation helps you understand and serve different groups effectively.
Shopify Analytics allows you to segment customers by:
- Geography: Country, region, city
- Purchase behavior: One-time vs. repeat, average spend, product preferences
- Engagement level: Active vs. at-risk vs. lapsed
- Acquisition source: How they originally found your store
Effective ways to use customer segments:
- Create targeted email campaigns for specific segments
- Develop product recommendations based on segment preferences
- Adjust marketing messages to resonate with different groups
- Identify your “ideal customer” segments and find more people like them
For example, you might discover that customers from California who purchase through Instagram have a 30% higher lifetime value than average. This insight could lead you to increase Instagram ad spending in that region.
Now that you understand your customers better, let’s look at how your store itself is performing. Are visitors finding what they need? Is your website converting effectively? The store performance metrics will give us these crucial insights!
Store Performance Metrics
Your store’s performance metrics reveal how well your website converts visitors into customers. These technical indicators can highlight opportunities for immediate improvement.
Conversion Rate
Conversion rate is the percentage of visitors who complete a purchase. It’s calculated as:
Conversion Rate = (Number of Transactions ÷ Number of Sessions) × 100
The average e-commerce conversion rate is between 1-3%, but this varies widely by:
- Industry and product type
- Price point (higher-priced items typically have lower conversion rates)
- Traffic source (direct traffic often converts better than social)
- Device type (desktop usually outperforms mobile)
To improve your conversion rate:
- Simplify your checkout process: Remove unnecessary fields and steps
- Add trust signals: Reviews, security badges, clear return policies
- Improve product pages: Better images, detailed descriptions, clear pricing
- Optimize site speed: Every second of delay reduces conversions by 7%
- Use exit-intent popups: Offer a discount to visitors about to leave
A/B testing is invaluable for conversion optimization. Test one element at a time (like button color, headline, or product image) to see what drives more sales.
Cart Abandonment Rate
Cart abandonment happens when shoppers add items to their cart but leave without completing the purchase. The average abandonment rate across e-commerce is around 70%—representing a huge recovery opportunity!
In Shopify Analytics, you can find abandoned cart data in the “Behavior” section. Look for patterns in:
- Which products are frequently abandoned
- At what stage customers typically leave
- Whether abandonment increases at certain price thresholds
Effective strategies to reduce cart abandonment:
- Abandoned cart email sequences (these can recover 10-15% of lost sales)
- Exit-intent offers that appear when users try to leave
- Transparent shipping costs shown early in the purchase process
- Multiple payment options including popular digital wallets
- Guest checkout option for customers who don’t want to create accounts
Tracking recovery rate is just as important as monitoring abandonment. Measure how effectively your recovery tactics bring customers back to complete their purchases.
Sessions by Device Type
Understanding how visitors access your store helps you optimize for the right devices. Shopify Analytics breaks down sessions by:
- Desktop computers
- Mobile phones
- Tablets
For most e-commerce stores, mobile traffic represents 60-70% of visits, but often has lower conversion rates than desktop. This “mobile gap” represents a significant opportunity.
When analyzing device metrics, pay attention to:
- Conversion rate differences between devices
- Average order value variations (desktop often has higher AOV)
- Bounce rate comparisons
- Time-on-site differences
To optimize for different devices:
- Ensure your mobile checkout is streamlined and easy to use
- Test your store on various screen sizes and browsers
- Consider device-specific promotions if certain devices underperform
- Optimize page load speed for mobile networks
Sessions by Traffic Source
Where do your visitors come from? This metric breaks down traffic by source:
- Direct: People typing your URL or using bookmarks
- Search: Traffic from Google and other search engines
- Social: Visitors from social media platforms
- Email: Sessions from your email marketing campaigns
- Referral: Traffic from other websites linking to you
For each traffic source, analyze:
- Conversion rate (which sources bring buyers, not just browsers?)
- Bounce rate (are visitors engaging with your content?)
- Average order value (do certain sources bring bigger spenders?)
- New vs. returning visitor ratio
This information helps you allocate your marketing budget more effectively. For instance, if Instagram traffic has a 0.5% conversion rate while Google search has 3%, you might want to shift resources toward SEO and Google Ads.
Now that we’ve covered the essential metrics, are you ready to take your analytics to the next level? Let’s explore some advanced features that can give you even deeper insights into your store’s performance.
Advanced Analytics Features
Once you’re comfortable with the basic metrics, these advanced features can help you extract even more value from your Shopify Analytics.
Live View
Live View gives you real-time insights into who’s on your store right now and what they’re doing. It’s like having a virtual storefront window where you can observe shopping behavior as it happens.
To access Live View:
- Go to Analytics > Live View
- See active visitors, their locations, and what they’re viewing
- Monitor real-time sales as they occur
Practical applications for Live View include:
- Flash sale monitoring: Watch customer response to limited-time offers
- Launch day insights: See immediate reaction to new products
- Customer service preparation: Notice traffic spikes that might lead to support queries
- Real-time troubleshooting: Identify unusual visitor patterns that might indicate website issues
While Live View is fascinating, don’t get addicted to watching it constantly. It’s best used during specific events or campaigns, not as a daily distraction.
Custom Reports
When standard reports don’t give you exactly what you need, custom reports allow you to combine different metrics and dimensions for deeper analysis.
To create a custom report:
- Go to Analytics > Reports > Create custom report
- Select your metrics (what you want to measure)
- Choose dimensions (how you want to break down the data)
- Apply filters if needed
- Save your report for future use
Useful custom reports to consider:
- Product performance by traffic source: Which marketing channels sell which products best?
- Conversion funnel by device: Where exactly do mobile users drop off compared to desktop?
- Geographic sales by product category: Do certain regions prefer specific product types?
- Time-of-day sales patterns: When are your peak selling hours?
When building custom reports, start with a clear question you want to answer. This prevents creating overly complex reports that don’t lead to actionable insights.
Cohort Analysis
Cohort analysis groups customers based on when they made their first purchase, then tracks their behavior over time. This reveals valuable patterns in customer retention and lifetime value.
While Shopify Plus offers built-in cohort analysis, standard Shopify stores can approximate this by:
- Exporting customer data to a spreadsheet
- Grouping customers by first purchase month
- Analyzing subsequent purchases by cohort
What to look for in cohort analysis:
- Retention trends: Are newer customer cohorts retaining better than older ones?
- Seasonal effects: Do holiday-acquired customers behave differently than those acquired during other seasons?
- Campaign impact: How do customers acquired during major promotions compare to those from non-promotional periods?
This analysis can reveal whether your customer experience is improving or deteriorating over time, and whether certain acquisition strategies bring in more loyal customers than others.
Funnel Analysis
Funnel analysis tracks how visitors move through your purchase process, showing where they drop off. Understanding these customer journey stages helps identify conversion bottlenecks.
A typical e-commerce funnel includes:
- Product page view
- Add to cart
- Begin checkout
- Enter shipping information
- Enter payment information
- Complete purchase
In Shopify, examine your funnel by:
- Reviewing the “Online store conversion” report
- Analyzing page-to-page navigation in Google Analytics (more on this in the next section)
- Using apps that provide enhanced funnel visualization
When you spot a significant drop-off point, investigate potential causes:
- Is shipping cost information surprising customers?
- Is the checkout form too complicated?
- Are there technical errors or slow load times?
- Is key information missing that would help customers decide?
Even small improvements to your funnel can have dramatic effects on overall conversion. A 10% improvement at each stage of a five-step funnel results in a 61% increase in final conversions!
While Shopify’s built-in analytics are powerful, sometimes you need even more capabilities. Let’s look at how you can enhance your analytics by connecting additional tools to your Shopify store.
Integrating External Analytics Tools
Shopify’s native analytics are excellent for day-to-day decision making, but integrating external tools can provide additional perspectives and deeper insights.
Google Analytics Integration
Google Analytics is a free, powerful tool that complements Shopify’s built-in analytics with additional functionality.
To connect Google Analytics to your Shopify store:
- Create a Google Analytics account if you don’t have one
- In Shopify, go to Online Store > Preferences
- Add your Google Analytics tracking ID in the appropriate field
- Enable enhanced e-commerce tracking
Key benefits of using Google Analytics with Shopify:
- Enhanced user behavior tracking: See exactly how visitors navigate through your site
- More detailed traffic source analysis: Break down traffic by specific campaigns or keywords
- Advanced segmentation capabilities: Create complex audience segments for deeper analysis
- Custom event tracking: Monitor specific user interactions like video views or form completions
- Goal setting and conversion path analysis: Track multiple conversion objectives beyond just purchases
A practical approach is to use Shopify Analytics for quick, daily business decisions and Google Analytics for deeper, periodic analysis and campaign planning.
Third-Party Analytics Apps
The Shopify App Store offers specialized analytics tools that focus on specific aspects of your business. Popular options include:
- Fabric: Focuses on customer lifetime value and retention metrics
- Polar Analytics: Provides enhanced marketing attribution and customer journey insights
- BeProfit: Specializes in profit calculation by factoring in all costs, including shipping and transaction fees
- Lucky Orange: Offers heatmaps and session recordings to see exactly how visitors interact with your site
- Glew.io: Provides advanced segmentation and merchandising analytics
When selecting third-party analytics apps, consider:
- What specific analytics gap you’re trying to fill
- Integration capabilities with your other business tools
- Cost versus value provided
- User interface simplicity and learning curve
- Support and training resources
Avoid app overload—each new tool adds complexity and data to manage. Choose only the apps that address critical blind spots in your current analytics setup.
Data Export and Custom Analysis
For the most advanced analysis, you can export your Shopify data and work with it in external tools:
Common export options include:
- CSV exports of orders, products, customers, and more from Shopify admin
- Scheduled exports using apps like Exportify or Matrixify
- API connections for automated data pulling into other systems
Tools for custom analysis:
- Microsoft Excel: Good for basic analysis with pivot tables and charts
- Google Data Studio: Creates interactive dashboards from multiple data sources
- Tableau: Powerful visualization tool for complex data relationships
- Power BI: Microsoft’s business intelligence tool for comprehensive data analysis
- Python/R: Programming languages for statistical analysis and machine learning
For large stores, consider implementing a data warehouse solution like Google BigQuery or Amazon Redshift. These allow you to combine Shopify data with information from other business systems for truly unified analysis.
Now that we’ve explored all these powerful tools and metrics, you might be wondering how to put them together into a coherent strategy. Let’s look at how to create an effective analytics approach that drives real business growth!
Creating an Analytics Strategy
Having access to data is one thing—knowing how to use it strategically is another. Let’s build a framework for turning your analytics into actionable business decisions.
Setting Performance Benchmarks
Without benchmarks, metrics are just numbers. You need context to understand if your performance is good or needs improvement.
Types of benchmarks to establish:
- Historical benchmarks: How are you performing compared to your own past?
- Industry benchmarks: How do you compare to similar businesses in your niche?
- Competitor benchmarks: How does your performance stack up against direct competitors?
- Goal-based benchmarks: What targets have you set for your business?
To set effective benchmarks:
- Identify 5-7 key metrics that directly impact your business goals
- Research industry averages (resources like the Shopify Benchmark Report can help)
- Analyze your historical performance to establish baseline expectations
- Set SMART goals (Specific, Measurable, Achievable, Relevant, Time-bound)
- Create visual scorecards that show progress toward benchmarks
Remember that benchmarks should evolve as your business grows. What’s excellent performance for a new store might be concerning for an established business.
Regular Reporting Cadence
Consistent reporting rhythms help ensure that analytics become part of your business culture rather than an afterthought.
Effective reporting schedules include:
- Daily quick checks: 5-minute reviews of sales, traffic, and conversion rates
- Weekly reviews: Deeper dives into campaign performance and inventory status
- Monthly analysis: Comprehensive assessment of all key metrics and progress toward goals
- Quarterly strategic reviews: Big-picture evaluation and planning sessions
Different team members may need different reports:
- Marketing team: Traffic sources, campaign performance, conversion rates by channel
- Product team: Product sales rankings, review ratings, inventory turnover
- Customer service: Customer satisfaction metrics, support ticket volumes, return rates
- Executive team: High-level KPIs, growth trends, profitability metrics
When creating reports, focus on insights rather than just data dumps. Every report should answer: “What happened, why it matters, and what actions we should take.”
Team Training and Adoption
Analytics are only valuable when they’re actually used. Building a data-driven culture requires making analytics accessible to everyone.
Steps to improve analytics adoption:
- Provide role-specific training on relevant metrics and tools
- Create simple dashboards that non-technical team members can understand
- Celebrate data-driven wins to reinforce the value of analytics
- Start meetings with key metrics to center discussions around data
- Document definitions and calculations so everyone speaks the same language
Common barriers to analytics adoption include:
- Complex interfaces that intimidate non-technical users
- Data overload that makes it hard to find relevant insights
- Lack of trust in data accuracy
- Unclear connections between metrics and daily work
Address these barriers by starting small, focusing on actionable metrics, and gradually building analytics literacy across your organization.
Continuous Optimization Framework
Analytics shouldn’t just inform you—they should drive ongoing improvement. A continuous optimization framework turns insights into action.
The optimization cycle includes:
- Measure: Collect data on current performance
- Analyze: Identify patterns, problems, and opportunities
- Hypothesize: Develop theories about what changes might improve results
- Test: Implement changes in a controlled manner
- Learn: Measure the impact and incorporate learnings
- Repeat: Continuously refine based on new data
When prioritizing optimization efforts, consider:
- Impact potential: Which changes could move the needle most?
- Implementation difficulty: What can be done quickly with available resources?
- Test confidence: How certain are you that a change will be positive?
Even small, incremental improvements compound over time. A store that improves conversion rate by just 0.1% each month will see a 12.7% annual increase—potentially worth thousands in additional revenue.
Learning from others can accelerate your analytics journey. Let’s look at some real-world examples of stores that have leveraged Shopify Analytics for remarkable results.
Case Studies and Examples
There’s nothing quite as instructive as seeing how other businesses have successfully used analytics to drive growth. Let’s explore some inspiring examples.
Successful Analytics Implementation
Case Study 1: Beauty Brand Reduces Cart Abandonment
A skincare company noticed their cart abandonment rate was 78%, well above the industry average. Diving into their Shopify Analytics, they discovered:
- Mobile users abandoned at a 23% higher rate than desktop
- Abandonment spiked dramatically when shipping costs appeared
- First-time visitors abandoned more frequently than returning customers
They implemented three changes based on these insights:
- Simplified their mobile checkout process, reducing fields by 40%
- Added a free shipping threshold just above their average order value
- Created a first-purchase discount that appeared during checkout
Results: Cart abandonment dropped to 64% within three months, and average order value increased by 15% as customers added items to reach the free shipping threshold. Overall revenue grew by 28%.
Case Study 2: Apparel Store Optimizes Marketing Spend
A clothing retailer was spending equally across Facebook, Instagram, and Google Ads but wasn’t sure which channel delivered the best ROI. By connecting Google Analytics to their Shopify store and analyzing traffic sources, they discovered:
- Google Ads had a 4.2% conversion rate vs. 1.8% for Facebook
- Instagram users had the highest average order value ($72 vs. $58 for other channels)
- Facebook brought in more first-time customers, while Google Ads converted more returning visitors
Based on these insights, they reallocated their marketing budget:
- Increased Google Ads spend for their best-selling evergreen products
- Focused Instagram campaigns on their premium, high-margin items
- Used Facebook primarily for new product launches and customer acquisition
Results: Overall marketing ROI improved by 47%, and total sales increased by 32% without increasing the total marketing budget.
Industry-Specific Analytics Approaches
Different types of Shopify stores need different analytics approaches. Here’s how various industries can optimize their analytics strategy:
Fashion and Apparel
- Key metrics: Size/color variant performance, return rate by product, seasonal trend identification
- Analytics focus: Visual merchandising effectiveness, size recommendation accuracy
- Unique consideration: High importance of mobile optimization as fashion shoppers skew heavily toward mobile browsing
Food and Beverages
- Key metrics: Repeat purchase frequency, subscription conversion rate, regional taste preferences
- Analytics focus: Customer retention, inventory freshness, seasonal demand forecasting
- Unique consideration: Critical to track fulfillment metrics like delivery time due to product perishability
Home and Furniture
- Key metrics: Browse-to-purchase time (often longer), product bundle performance, average items per order
- Analytics focus: Customer journey length, financing option usage, room collection analysis
- Unique consideration: Higher importance of detailed session analysis as purchasing decisions take multiple visits
Digital Products
- Key metrics: Download completion rate, upsell conversion, license renewal rate
- Analytics focus: Delivery success, customer account usage, subscription analytics
- Unique consideration: Critical to track post-purchase usage metrics to reduce refund requests
Whatever your industry, customize your analytics approach to focus on the metrics that most directly impact your specific business model and customer behavior patterns.
As we look to the future, how will analytics continue to evolve? Let’s explore emerging trends that will shape how Shopify merchants use data in the coming years.
Future Trends in Shopify Analytics
The world of e-commerce analytics is rapidly evolving. Staying ahead of these trends can give your store a competitive advantage.
Emerging Analytics Technologies
Several technological advances are transforming how merchants understand and use their data:
AI and Machine Learning Integration
- Predictive analytics that forecast customer behavior and sales trends
- Automatic anomaly detection that flags unusual patterns requiring attention
- Smart product recommendations that continuously optimize based on real-time data
- Customer lifetime value prediction to identify high-potential shoppers early
Advanced Personalization
- Individual customer journeys mapped across multiple touchpoints
- Real-time personalization based on behavioral signals
- Micro-segmentation that creates highly specific customer groupings
- Predictive personalization that anticipates needs before they’re expressed
Voice and Visual Analytics
- Voice interfaces for querying business data
- Visual pattern recognition for product performance clustering
- Augmented reality analytics showing store performance in physical space
- Automated visual competitive analysis
Shopify continues to enhance its native analytics capabilities, with recent updates focusing on:
- Enhanced marketing attribution models
- More powerful custom report builders
- Integrated benchmarking against similar stores
- Expanded API capabilities for data integration
Privacy Considerations
As analytics capabilities grow, so do concerns about user privacy and data protection:
Regulatory Changes
- GDPR, CCPA, and emerging global privacy regulations
- Cookie deprecation and its impact on tracking
- Consent management requirements
- Data localization requirements in certain regions
First-Party Data Strategy
- Building direct relationships that generate owned customer data
- Loyalty programs as first-party data sources
- On-site behavior tracking that doesn’t rely on third-party cookies
- Transparent value exchanges for customer information
Ethical Considerations
- Balancing personalization with privacy concerns
- Transparent data policies that build customer trust
- Ethical use of behavioral insights
- Data minimization principles
Forward-thinking merchants are preparing for these changes by:
- Investing in first-party data collection
- Implementing privacy-by-design principles
- Building customer relationships based on transparent value exchange
- Adopting consent-first approaches to data collection
As we wrap up our exploration of Shopify Analytics, let’s summarize the key takeaways and provide a roadmap for putting these insights into action.
Conclusion
Throughout this guide, we’ve explored how Shopify Analytics can transform your e-commerce business from guesswork to data-driven decision making. Let’s recap the key benefits of mastering your store’s analytics:
- Informed decision making that reduces risk and increases success probability
- Customer insights that help you serve your audience better
- Marketing optimization that improves return on advertising spend
- Conversion improvements that turn more browsers into buyers
- Operational efficiency that reduces costs and improves margins
Remember that analytics is not a one-time project but an ongoing journey. The most successful merchants:
- Start simple with the most important metrics for their business
- Establish regular review habits to keep data top of mind
- Focus on actionable insights rather than just collecting numbers
- Test and iterate based on what the data reveals
- Continuously learn and expand their analytics capabilities
For implementation, consider this phased approach:
- Phase 1: Master Shopify’s built-in analytics and establish baseline metrics
- Phase 2: Implement Google Analytics for deeper insights into customer journeys
- Phase 3: Add specialized tools for specific business needs
- Phase 4: Develop advanced analysis capabilities and predictive modeling
Stores that commit to data-driven decision making consistently outperform their competitors. With the right analytics approach, you can identify opportunities others miss, optimize experiences that others neglect, and build customer relationships that others can’t match.
Ready to take your Shopify store to the next level? Remember that Growth Suite can help amplify your sales by leveraging the very metrics we’ve discussed. With its integrated marketing tools and analytics-driven optimization features, Growth Suite helps you turn insights into action—creating a virtuous cycle of continuous improvement and revenue growth.
References
- Mipler Blog. (2025, February 27). A Complete Guide To Shopify Analytics.
- Mageplaza. (2024, June 20). Shopify Dashboard: Everything you need to know.
- Shopify Help Center. (n.d.). Analytics.
- Scale Shopify. (2025, January 4). How To Track Shopify Store Performance Metrics.
- Avada Commerce. (2024, November 7). How to View the Overview Dashboard on Shopify.
- Cirkle Studio. (n.d.). Shopify Analytics: Understanding the Key Metrics.
- AgencyAnalytics. (2023, June 1). Shopify Analytics: 12 Key Metrics to Track.
- Coupler.io Blog. (2025, February 14). Shopify Analytics: a Guide to Analyzing Data for E-commerce Success.
- Shopify Help Center. (n.d.). Shopify analytics.