
Have you ever spent time improving your Shopify store—yet wondered if all those changes actually boosted sales? Or maybe you’re experimenting with new product pages or checkout processes, but you’re not sure how to track success. That’s exactly why this article was written! By the time you’re done reading, you’ll know exactly which metrics to watch, how to set up proper tracking, and how to measure real progress in your Conversion Rate Optimization (CRO) journey. Ready to dive in? Let’s get started!
Introduction to Conversion Rate Optimization for Shopify Stores
In this section, we’ll clarify what Conversion Rate Optimization (CRO) really is, why it matters for Shopify store owners, and how measuring your CRO efforts leads to stronger business results.
Defining CRO in E-commerce
Conversion Rate Optimization (CRO) is the process of making your online store more effective at turning visitors into buyers. It’s about data-driven improvements—small changes that encourage more people to complete a desired action, like placing an order or signing up for your newsletter.
Why Measuring CRO Success Is Critical
Research shows that CRO-optimized websites are 23 times more likely to attract new customers. When you measure your optimization efforts, you can refine what’s working and stop wasting time on what isn’t.
Data-Driven Impacts on Revenue
Companies that track and optimize using real data consistently see revenue boosts. Even a small increase in conversion rate can mean a big jump in your bottom line.
Business Benefits
By adopting a structured measurement approach, you’ll:
- Discover which strategies actually move the needle
- Make better decisions with real numbers behind them
- Build sustainable growth instead of chasing quick fixes
- Gain a competitive edge in a crowded market
You now know why measurement is so important. Next, let’s break down the conversion basics in a Shopify context!
Understanding Shopify Conversion Fundamentals
Here, you’ll learn about different types of conversions in Shopify, how Shopify calculates conversion rates, and why consistent measurement matters.
Defining Conversions in Shopify
Types of Conversions: A “conversion” can be a purchase, an add-to-cart, an email signup, or anything else you see as a key goal.
How Shopify Tracks Events: Out of the box, Shopify tracks product views, adds to cart, and checkouts. You can also set up custom goals if needed.
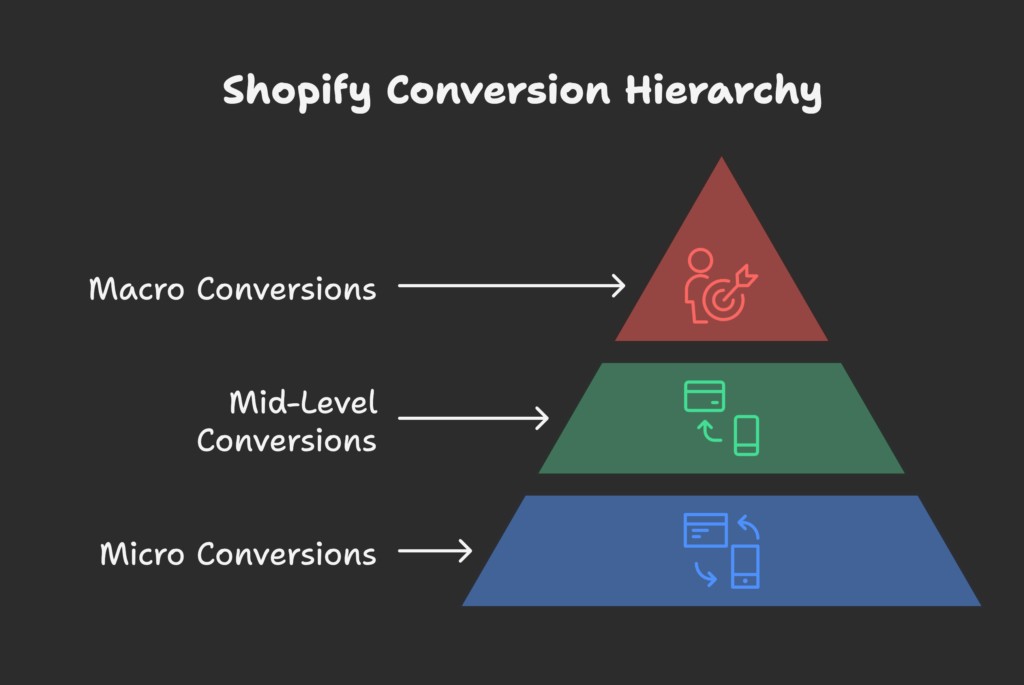
Customer Journey Stages: People might first just browse (micro conversion), then add items to cart (mid-level conversion), and finally purchase (macro conversion).
Micro vs. Macro Conversions: Micro conversions like email signups eventually lead to macro conversions (actual sales). Both matter for your CRO metrics.
Calculating Your Shopify Conversion Rate
Basic Formula: Conversion Rate = (Number of Conversions / Total Visitors) x 100.
Shopify Analytics: Shopify can auto-calculate key conversion rates in your store’s analytics, but make sure you understand the timeframe and segments measured.
Alternative Methods: Some owners only consider unique sessions, while others look at page views. Consistency is crucial—stick to one method so your data remains comparable.
Consistent Measurement: Define your approach and use the same approach each time. That way, you can track real progress over weeks and months.
You’ve got the basics of conversions. Let’s dig deeper into the specific metrics that matter most for CRO!
Key CRO Metrics for Shopify Stores
Next, we’ll look at which numbers are essential to monitor, from direct conversion rates to secondary metrics that signal where shoppers drop off.
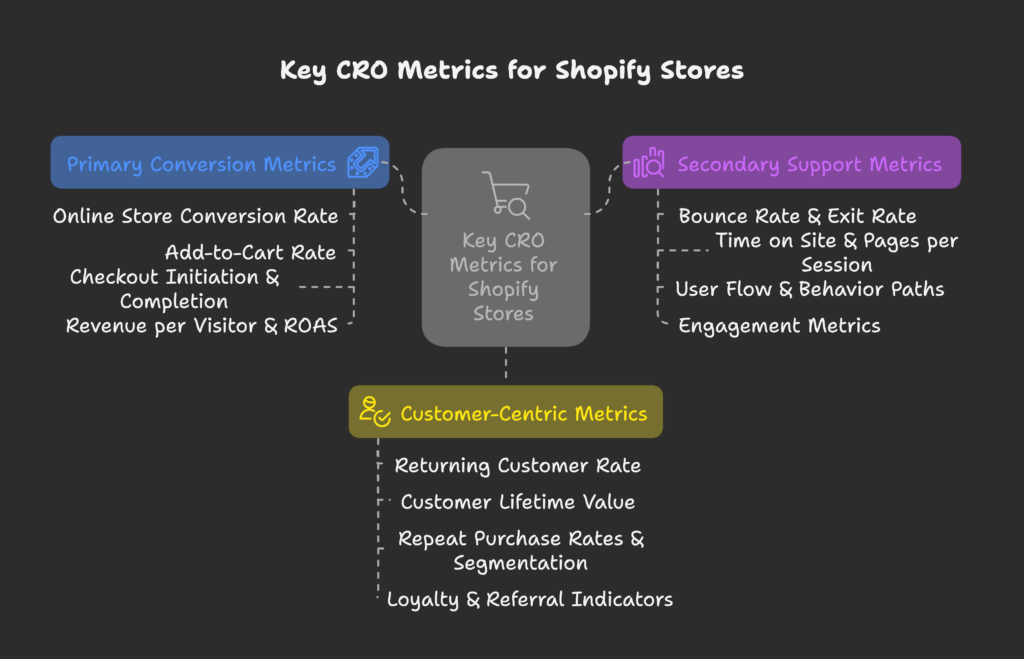
Primary Conversion Metrics
Online Store Conversion Rate: This is your bread-and-butter metric, telling you what percentage of visitors buy something.
Add-to-Cart Rate: Tracks how many visitors place items in their cart—a crucial first step toward a sale.
Checkout Initiation & Completion: Shows how effectively people move through the checkout. High initiation but low completion often signals checkout friction.
Revenue per Visitor (RPV) & ROAS: Revenue per visitor breaks down how much you earn on average per session, while ROAS (Return on Ad Spend) helps you see if your marketing costs are justified.
Secondary Support Metrics
Bounce Rate & Exit Rate: If many visitors bounce (leave immediately) or exit from key pages, something might be confusing or off-putting.
Time on Site & Pages per Session: More time on site and pages viewed usually mean higher engagement, which often predicts conversions.
User Flow & Behavior Paths: Analyzing how people move page to page can reveal bottlenecks or missing links.
Engagement Metrics: Click-through rates on calls to action, video views, or quiz completions also hint at how likely a user is to convert later.
Customer-Centric Metrics
Returning Customer Rate: A healthy store has shoppers coming back for more, reducing your reliance on new acquisitions.
Customer Lifetime Value (CLV): If you know your CLV, you can safely invest in higher-cost marketing that still yields profits in the long run.
Repeat Purchase Rates & Segmentation: Splitting out your high-value customers can show if certain groups respond better to your CRO changes.
Loyalty & Referral Indicators: Sign-ups for loyalty programs or friend referrals reflect genuine satisfaction with your store.
You can track a lot of metrics, but first you need to set up your measurement tools. Let’s see how to do that.
Setting Up Your Measurement Infrastructure
This section walks you through configuring Shopify analytics, integrating Google Analytics, and adding more tracking tools to get richer insights.
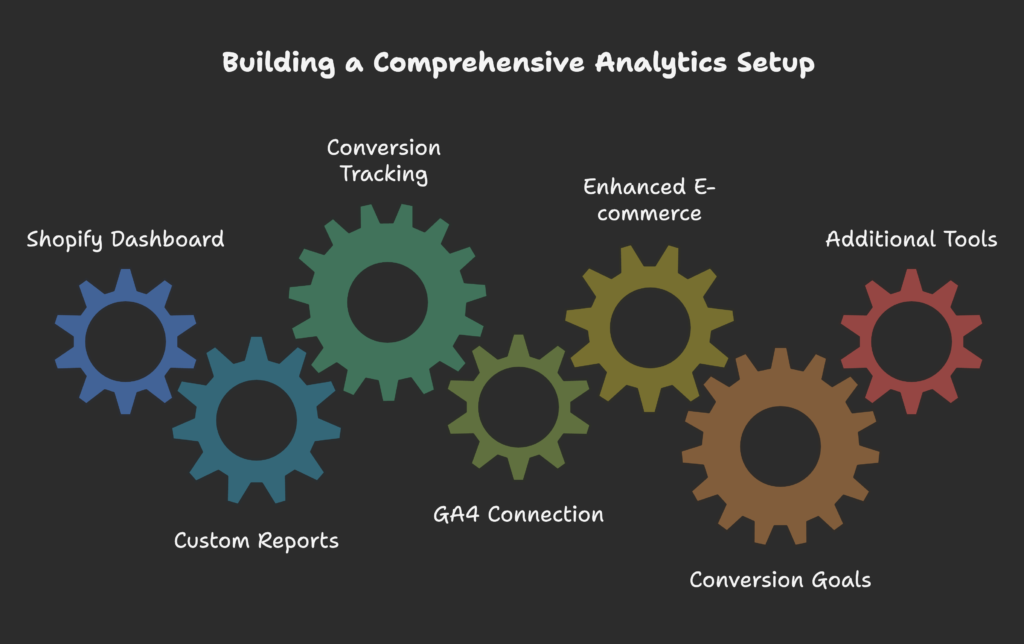
Shopify Analytics Configuration
Built-In Dashboard: Shopify’s default analytics show sales, conversions, traffic sources, etc.
Custom Reports: You can tweak or create new reports to focus on specific metrics. Learn to interpret them properly.
Conversion Tracking: Double-check that your checkout events and payment methods are tracked, so you don’t miss sales data.
Limitations: For advanced insights, Shopify’s native analytics might not be enough. Supplement with external tools for deep dives.
Google Analytics Integration
GA4 Connection: Linking Google Analytics (GA4) to your Shopify store provides a fuller picture of user behavior.
Enhanced E-commerce: This setup captures product views, cart actions, and checkout steps in more detail.
Conversion Goals & Funnels: GA4 lets you build custom funnels and goals to see exactly where people drop off.
Cross-Platform Reconciliation: If you advertise across multiple channels, GA4 can help unify data in one place.
Additional Tracking Tools
Heat Mapping & Session Recording: Tools like Hotjar or Lucky Orange let you see how visitors interact with your site, revealing UX issues.
A/B Testing Platforms: Services like Google Optimize or Optimizely let you run experiments and measure results within a single dashboard.
Customer Feedback & Surveys: Tools like Typeform or SurveyMonkey help you gather qualitative insights—why customers behave a certain way.
Data Warehouses: If you’re ready for advanced analysis, solutions like BigQuery can store large data sets for deep reporting.
Measurement tools are set. Now, let’s talk about setting realistic goals and benchmarks so you know whether your store is meeting expectations!
Establishing Benchmarks and Goals
Here, you’ll learn about average Shopify conversion rates, how to set improvement targets, and how to benchmark by segment or product category.
Industry Conversion Rate Benchmarks
Average Shopify Conversion Rates: The global average is around 1.4%, but results vary widely by niche.
By Industry: Food & beverage might see around 1.5%, fashion 1.9%. Keep in mind these are just general guides.
Mobile vs. Desktop: Desktop conversions often exceed 1.9%, while mobile might hover closer to 1.2%. Monitor each device channel.
Top Performers: The top 10% of Shopify stores can hit 4.7% or more—an aspirational target for many.
Setting Realistic CRO Goals
Incremental Approach: Don’t expect to jump from 1% to 5% overnight. Smaller steps (e.g., going from 1.5% to 2.0%) are more realistic and sustainable.
Baseline Metrics: Start by defining your current rates for conversions, cart adds, and so on. That baseline is your launchpad.
High-Impact Points: Identify areas with the biggest potential gains, like improving the checkout flow or homepage design.
Measurement Calendar: Schedule monthly or quarterly reviews to track progress and adjust your strategy.
Segment-Specific Benchmarking
Traffic Source & Channel: Conversion rates can differ between Facebook ads, Google search, or email campaigns.
Device Type & Location: Mobile vs. desktop, and various countries might have unique conversion patterns.
New vs. Returning Visitors: Repeat visitors typically convert better, so track those segments separately.
Product Category & Price-Point Differences: Higher-priced items might have lower conversion rates but higher average order values.
You have your benchmarks. Let’s see how to run tests to improve these metrics systematically!
CRO Testing Methodologies
This section reveals how to conduct A/B tests, multivariate tests, and how to integrate testing into your Shopify store.
A/B Testing Framework
Scientific Approach: Formulate a hypothesis, like “Adding a free shipping banner will increase conversions.”
Hypothesis Development: Base it on data (e.g., many customers drop off at shipping cost).
Prioritizing Tests: Use frameworks like ICE (Impact, Confidence, Ease) to decide which ideas to test first.
Statistical Significance: Wait until enough visitors have seen each version to confirm results aren’t random.
Multivariate Testing Approaches
When to Use: If you want to test multiple elements (e.g., headline + product image + CTA color) at once.
Planning & Executing: Prepare systematically, because each extra variant needs significant traffic for reliable data.
Traffic Requirements: Higher traffic stores can handle multivariate tests better, while smaller stores might find it challenging.
Analyzing Interaction Effects: Sometimes changes interact. A new headline might only work well with a certain CTA color.
Testing Implementation on Shopify
Native Capabilities: Shopify doesn’t have a robust built-in testing tool, so you might rely on third-party apps or external tools.
Third-Party Tools: Services like Google Optimize, VWO, or Optimizely integrate with Shopify for easy test setups.
Technical Considerations: Some scripts or code might conflict with your theme; always test carefully on staging if possible.
Quality Assurance: Double-check that each variant displays correctly on different devices before letting visitors see it.
You’re running tests. Next comes analyzing the results to see what actually worked and why. Let’s go!
Analyzing CRO Test Results
After your experiments run, you need to collect data, apply statistics, and interpret findings in a way that leads to clear next steps.
Data Collection Methodologies
Quantitative Data: Focus on numerical insights like conversion rates, cart additions, and average order value.
Qualitative Feedback: Read survey responses, watch session recordings, or check user comments for deeper context.
Unified Data Views: Use dashboards that combine Shopify metrics with testing platform data.
Data Cleaning & Preparation: Remove spam or irrelevant sessions so they don’t skew your results.
Statistical Analysis of Results
Confidence Levels & Significance: A 95% confidence level means there’s only a 5% chance your results are random.
Conversion Lift Calculations: If one variant outperforms another by X%, that’s your “lift.”
Segmentation of Results: Check if certain user segments (mobile vs. desktop) react differently to changes.
Controlling External Factors: Account for seasonality, ads, or promotions that might influence your test window.
Result Interpretation Frameworks
Actionable Conclusions: Don’t just note a +10% improvement; figure out why it happened. That insight guides future changes.
Identifying Patterns: If multiple tests show a preference for simpler design, that might be a broader theme.
Correlation vs. Causation: A spike in sales might also coincide with an external factor. Be cautious in drawing direct causes.
Documentation Best Practices: Keep a log of each test, results, and lessons learned so your team can revisit them later.
You’ve interpreted the data. Now, let’s see how to put these findings into action for real store improvements.
Implementing Improvements Based on Data
Here, you’ll learn how to prioritize winning ideas, roll them out effectively, and keep track of whether your changes maintain positive results.
Prioritizing Optimization Opportunities
Impact vs. Effort: Make a simple matrix rating potential changes by how much effort they need vs. the possible impact on conversions.
ROI-Based Decisions: Focus on the actions most likely to bring a solid return, like improving the checkout for big-ticket items.
Quick Wins vs. Long-Term Strategies: Some changes, like adding trust badges, might yield fast gains. Bigger site redesigns might require more planning.
Creating an Optimization Roadmap: Build a timeline showing which changes happen when, so you don’t confuse customers with too many simultaneous updates.
Implementation Strategies
Phased Rollout: If you’re unsure about a big change, gradually roll it out to segments of your traffic before going store-wide.
Changelog Management: Keep a record of what was changed and when, so you can track any unusual spikes or dips.
Cross-Team Coordination: Marketing, design, and development should collaborate seamlessly. Each group’s input ensures changes align with brand and function.
Post-Implementation Monitoring: Check conversion and performance metrics soon after going live, to catch issues early.
Measuring Implementation Success
Before/After Comparison: Compare your baseline with new data post-change to see the exact improvement.
Attribution of Improvements: If you made multiple changes at once, it can be tricky to know which factor drove results. Where possible, isolate each change.
Complex Implementation Variables: When changes overlap, consider advanced testing or longer measurement periods.
Continuous Improvement Framework: Even if you see good results, keep testing. Ongoing tweaks often lead to more growth.
You’ve got the main approach. Now, let’s explore advanced measurement methods for deeper insights.
Advanced CRO Measurement Techniques
At this stage, we’ll dive into segmentation analysis, journey mapping, and predictive modeling—useful for stores seeking an extra edge.
Customer Segmentation Analysis
Cohort Analysis: Group customers by the month they made their first purchase or other criteria to see how behavior evolves over time.
RFM Analysis: Recency, Frequency, Monetary segmentation helps identify high-value shoppers for more targeted campaigns.
Behavioral Segmentation: Tailor your site experience to user behavior, like showing different promos to frequent browsers vs. new visitors.
Predictive Analytics: Use historical data to guess which customer segments are most likely to convert if offered a discount or free shipping.
Customer Journey Analytics
Journey Mapping: Track from first click to final purchase, identifying where customers hesitate or drop off.
Friction Points: Look for steps with high abandonment (like shipping info or payment steps). Fixing these often yields big gains.
Multi-Device Analysis: People might browse on mobile, then buy on desktop. Merge that data to see the full picture.
Attribution Modeling: Assign credit to each channel (e.g., email vs. social) so you invest in the best performers.
Predictive CRO Modeling
Historical Data Insights: Spot patterns in your store’s past data that predict future buying habits.
Machine Learning Applications: Some advanced tools can automate testing, recommending which site elements to change.
Automated Testing & Personalization: Systems can dynamically show different versions to different user segments based on predicted preferences.
Building Predictive Models: A significant data science project, but can pay off for larger stores with robust traffic.
You know the advanced stuff. Let’s look at some real-life success stories to inspire your own CRO journey.
Case Studies: Measuring CRO Success in Action
Here are three examples of measurable improvements in different areas of a Shopify store, along with how results were tracked.
Case Study 1: Checkout Optimization
- Problem: High cart abandonment at the shipping details step.
- Solution: Simplified the checkout page by reducing required fields and adding trust badges.
- Results: Achieved a 15% decrease in cart abandonment, leading to a noticeable boost in monthly revenue.
- Key Takeaway: Track each checkout step individually to pinpoint friction points.
Case Study 2: Product Page Enhancement
- Problem: Low conversion rate despite decent traffic.
- Solution: Added high-quality images, social proof (reviews), and a clear “Add to Cart” CTA near the top.
- Results: Saw a 25% increase in conversion, verified via an A/B test lasting three weeks.
- Key Takeaway: Regularly test content elements on product pages; small design tweaks can pay off.
Case Study 3: Mobile Optimization
- Problem: Mobile users bouncing at a higher rate than desktop.
- Solution: Improved mobile site speed and simplified navigation with a sticky “Add to Cart” button.
- Results: Mobile conversion jumped significantly, catching up to 80% of the desktop rate.
- Key Takeaway: Track separate metrics for mobile and desktop to understand device-specific issues.
Time to bring these ideas into your team! Learn how to build a measurement-focused culture that keeps improving.
Building a CRO Measurement Culture
This section shows how to embed data-driven optimization into your organization’s daily processes, from team roles to reporting.
Team Structure and Responsibilities
Key Roles: A CRO manager leads tests, developers handle coding changes, designers tweak visuals, and marketers interpret results.
Training Needs: Teach each team member the basics of analytics so they can contribute meaningful ideas.
Cross-Functional Collaboration: Encourage regular brainstorming so all perspectives—technical, creative, business—are heard.
Communication Frameworks: Weekly or monthly sprints can keep your CRO workflow on track.
Reporting and Data Visualization
Dashboards: Create easily digestible dashboards showing the metrics that matter (conversion rate, revenue, etc.).
Data Storytelling: Instead of just numbers, share a narrative: “Changing our checkout flow improved purchase rates by 10%.”
Automated Reporting: Tools like Google Data Studio can pull data automatically, saving time and ensuring consistency.
Presenting CRO Results: Tailor presentations for different stakeholders—execs might want the big picture, while devs need detailed insights.
Continuous Learning Framework
Knowledge Sharing: Document each test, result, and lesson in a shared repository.
Ongoing Education: Stay updated on CRO trends, software, and new best practices.
Benchmarking & Competitive Analysis: Compare your store’s performance with industry data to see where you stand.
Test-and-Learn Organization: Foster an environment where experimentation and honest data discussions are the norm.
You’re set to maintain a strong CRO culture. Finally, let’s peek into the future of measurement and how privacy changes might shape your approach.
Future Trends in CRO Measurement
Here, we’ll look at emerging technologies that will influence the way we measure CRO, plus the increasing focus on privacy-first analytics.
Emerging Technologies
AI & Machine Learning: AI can automatically identify conversion drops and make suggestions for A/B tests.
Predictive Analytics: More tools will forecast how likely a visitor is to buy, letting you adjust tactics in real-time.
Voice Commerce: As voice shopping grows, new metrics (like voice-based cart additions) will appear.
Future Preparation: Keep experimenting with new platforms and remain agile to adopt technologies that prove valuable.
Privacy-First Analytics
Navigating Regulations: GDPR, CCPA, and other data laws require careful handling of user info.
First-Party Data Strategies: Building direct relationships with customers can help you gather insights without relying on third-party cookies.
Ethical Considerations: Transparency about tracking builds trust and brand loyalty.
Sustainable Measurement Approaches: Align your analytics with privacy norms to future-proof your CRO efforts.
We’ve covered a lot of ground. Let’s wrap everything up with key takeaways and your next steps!
Conclusion
Measuring the success of your Shopify CRO efforts is all about knowing which numbers to watch, setting clear goals, running well-structured tests, and turning data into actionable improvements. From setting up essential tools like Google Analytics to testing your checkout process for friction points, each part of your measurement journey guides your store toward higher conversions and happier customers. Remember, CRO is never one-and-done. It’s a continuous process of testing, analyzing, and refining for ongoing growth and competitive advantage.
Quick Note: If you’re looking for an easy way to boost your Shopify store’s performance, consider using Growth Suite. It simplifies your marketing efforts, helps you track essential metrics, and can increase your revenue—without the stress or guesswork!
References
- Gelato. (2024, November 26). Shopify Conversion Rate Optimization: 12 Effective Strategies – Gelato.
- Checkoutlinks. (2024, August 24). What does CRO – Conversion Rate Optimization mean in Shopify.
- Littledata. (2023, January 1). Average Ecommerce Conversion Rate – Littledata.
- First Pier. (2023, August 15). Mastering Shopify: Your Ultimate CRO Checklist for 2024! – First Pier.
- Shopify Blog. (2024, July 19). What Is CRO Testing and How To Conduct It (2024) – Shopify.
- Akohub. (2024, July 31). How Does Shopify Calculate Conversion Rate?[2024] – Akohub.
- Shopify Blog. (2024, July 18). What Is Conversion Rate Optimization (CRO)? Strategies and Tools.
- Enhencer. (2025, January 1). Shopify Facebook Ads: Industry Benchmarks for Conversion Rates.
- Littledata Help. (2025, January 14). How to Measure Shopify Product Conversion Rate in GA4.
- PageFly. (2024, September 24). Shopify Conversion Rate: How to Measure and Improve It – PageFly.
- Shopify Help Center. (2021, November 1). Measuring marketing performance – Shopify Help Center.
- Conversios. (2024, October 3). The Right Way to Optimize Shopify Metrics with Conversios App.
- GemPages. (2024, December 27). Shopify CRO: Key Metrics for Optimal Performance – GemPages.
- Shopify Help Center. Viewing order conversion summary – Shopify Help Center.
- Shogun. (2024, July 3). Mastering the Art of Shopify Conversion Rate Optimization – Shogun.