
Have you ever felt lost when looking at your Shopify store’s stats? Do you wonder which numbers actually matter? Don’t worry—you’re not alone! Many store owners feel overwhelmed by data. But here’s the good news: by the time you finish reading this article, you’ll know how to collect, understand, and use Shopify data to make smart decisions that can boost your sales and keep customers coming back. Ready to dive in? Let’s get started!
Introduction to Shopify Data Analysis
In this section, you’ll find out exactly what data analysis means for your Shopify store and why it’s so important. We’ll also look at a few statistics that show how powerful data-driven decision making can be.
Defining Data Analysis in E-commerce
Data analysis is about collecting information—like sales numbers, website traffic, and customer behavior—and using it to guide smarter choices. For Shopify owners, it could mean studying which products sell best or seeing which marketing campaigns bring in the most visitors.
Why Data-Driven Decisions Matter
Studies have shown that businesses that rely on data are 23 times more likely to gain new customers, 6 times more likely to keep existing ones, and 19 times more likely to be profitable. If you want a competitive edge, using data is the way to go.
Business Benefits of Structured Analytics
A clear approach to analyzing your Shopify data helps you spot trends, adjust your marketing plans, and even predict future sales patterns. It’s like having a road map that shows you exactly where to focus your energy.
The Framework Ahead
We’ll walk through everything from setting up analytics and choosing key metrics to advanced techniques like cohort analysis and predictive modeling. By the end, you’ll have a solid plan for making informed decisions.
You’ve just seen why data analysis is critical. Next, let’s explore the basics of Shopify analytics and the tools available.
Understanding Shopify Analytics Fundamentals
In this part, you’ll learn about Shopify’s built-in analytics features and how they compare to external solutions. We’ll also explore when to use each approach.
Shopify’s Native Analytics Platform
Shopify has a built-in dashboard where you can see reports on Sales, Acquisition, Behavior, and Marketing. You can customize the date ranges and compare different periods. However, these native reports might have limitations if you need very specific data slices.
Sometimes, the basic reports are enough for small stores. But as you grow, you may want more advanced insights or deeper integrations with other platforms.
Different Approaches to Shopify Analytics
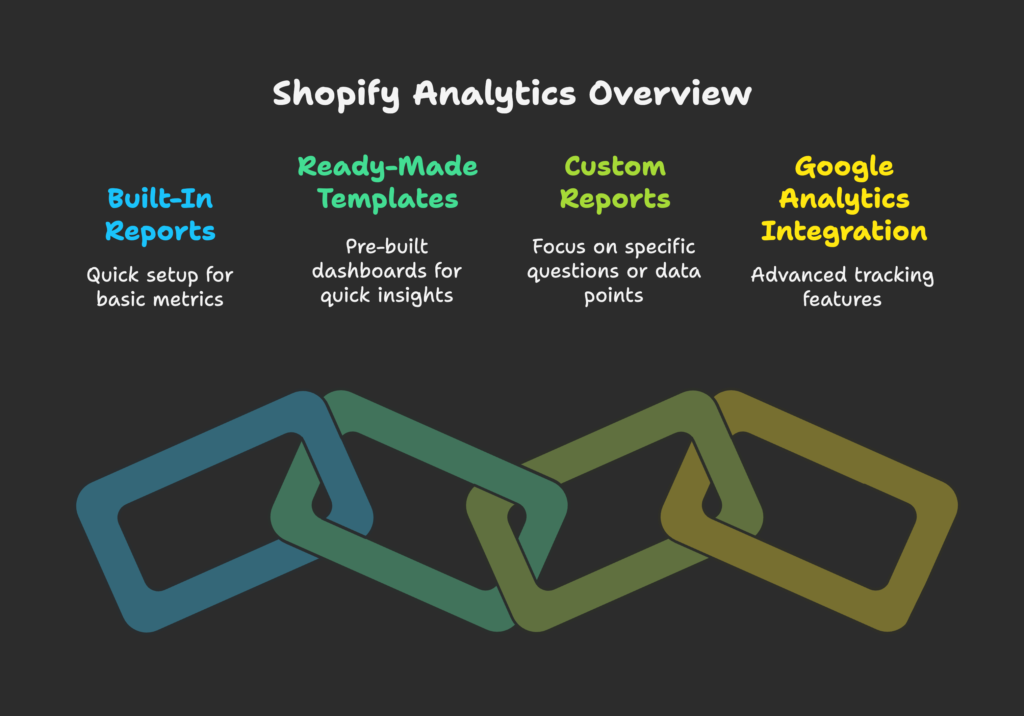
- Built-In Reports: Quick to set up and useful for basic metrics, but limited in customization.
- Ready-Made Templates: Some reporting solutions provide pre-built dashboards for quick insights.
- Custom Reports: Great if you want to focus on very specific questions or unusual data points.
- Google Analytics Integration: Adds advanced tracking features like funnels and detailed customer behavior.
Now that you know the fundamental tools, let’s move on to setting them up for your own Shopify store.
Setting Up Analytics for Your Shopify Store
This section will guide you through connecting and customizing Shopify’s analytics, integrating Google Analytics, and exploring third-party tools.
Accessing and Configuring Shopify Analytics
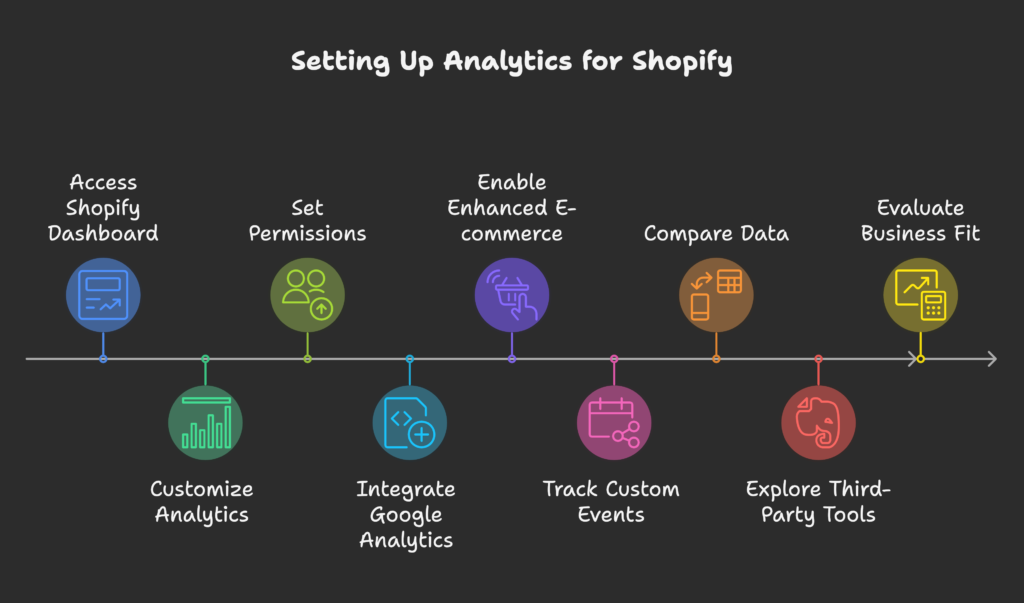
- Accessing the Dashboard: Log in to your Shopify admin, then click “Analytics” to see key reports.
- Customization: Adjust the date range, compare periods, and choose which metrics to show.
- Permissions: Decide who on your team can view or edit reports.
- Date Range Comparison: Track trends by comparing weeks, months, or entire seasons.
Integrating Google Analytics
- Connecting to Shopify: Copy your Google Analytics tracking code and paste it into your Shopify preferences.
- Enhanced E-commerce: Enable advanced tracking to see detailed product, cart, and checkout behaviors.
- Custom Events and Goals: Track events like button clicks or newsletter sign-ups for deeper insights.
- Data Reconciliation: Compare data between Shopify and Google Analytics for accuracy.
Third-Party Analytics Tools
- Popular Tools: Panoply, Supermetrics, and Conversific offer specialized insights and integrations.
- Integration Process: Most require installing an app or connecting an API key.
- Business Fit: Choose tools based on your data needs, budget, and technical expertise.
- Cost-Benefit: Weigh the subscription fees against how much time (and money) they might save you.
You’re now all set up with analytics. Next, let’s explore which metrics really matter so you can focus on the numbers that impact your bottom line.
Essential Shopify Metrics and KPIs
In this section, you’ll discover the most important metrics—like sales, traffic, and conversion—to keep your store growing.
Sales and Revenue Metrics
- Total vs. Net Sales: Know the difference after returns or discounts.
- Average Order Value (AOV): Measures how much shoppers spend in each transaction.
- Revenue Breakdown: Track by channel, product, or time period for a clearer picture.
- Profit Margin: Don’t forget to track how much profit you actually make after costs.
Traffic and Acquisition Metrics
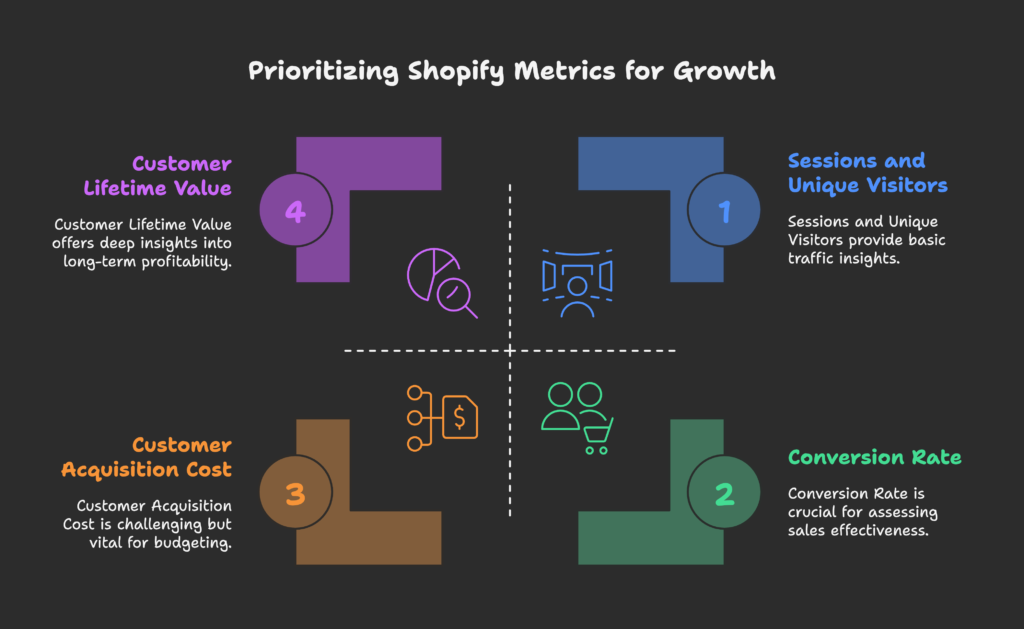
- Sessions and Unique Visitors: The total number of visits and individual visitors.
- Traffic Sources: Identify if visitors come from social media, search engines, or referrals.
- Customer Acquisition Cost (CAC): How much you spend on marketing to gain one paying customer.
- Campaign Tracking: Measure which campaigns drive the most traffic and conversions.
Conversion Metrics
- Conversion Rate: The percentage of visitors who make a purchase.
- Shopping Behavior: Look at browse-to-cart and cart-to-checkout patterns.
- Cart Abandonment Rate: The percentage of shoppers who leave items in their cart without checking out.
- Checkout Completion: Tracks how many people who start checkout actually finish it.
Customer Metrics
- Customer Lifetime Value (CLV): Estimates how much a shopper will spend over time.
- Returning Customer Rate: The percentage of buyers who come back for another purchase.
- Segmentation: Group customers based on location, spend level, or shopping frequency.
- Acquisition vs. Retention: Compare how many new customers you get vs. how many you keep.
Now you know which numbers matter. Ready to learn how customers behave and how to analyze their journey? Let’s dive in!
Analyzing Customer Behavior
This part explores how to understand your shoppers’ browsing habits, their purchase patterns, and the differences between mobile and desktop use.
Shopping Patterns Analysis
- Customer Journey Mapping: Note the steps shoppers take, from landing on your site to completing a purchase.
- Browsing Behavior: See which pages they visit and how long they stay.
- Search Term Analysis: Understand what keywords people use in your on-site search bar.
- Heat Maps and Session Recordings: Find out where people click or get stuck.
Purchase Behavior Analysis
- Product Affinity: Discover which items are often bought together.
- Seasonal Trends: Check if certain items sell more at specific times of the year.
- Price Sensitivity: See if small price changes affect sales.
- Promo Impact: Evaluate how discounts or coupons change buying habits.
Mobile vs. Desktop Behavior
- Device Metrics: Compare conversion rates and average order values across devices.
- Responsive Design Influence: Poor mobile layouts can hurt sales.
- Mobile Conversion Optimization: Streamline mobile checkout for fewer drop-offs.
- Cross-Device Shopping: Some people browse on a phone but buy on a desktop later.
You’ve seen how your customers behave. Next up: let’s examine product performance to see what’s driving sales—and what isn’t.
Product Performance Analysis
In this section, you’ll learn how to identify your best-selling products, assess their profitability, and improve your product pages for better conversions.
Top Performing Products
- Sales Rankings: Sort products by total units sold or total revenue.
- Margin and Profit: Look at how much you make on each item after costs.
- Seasonal Shifts: Certain items may spike during holidays or specific months.
- Inventory Turnover: Track how quickly each product sells and restocks.
Product Page Optimization
- Conversion Rate by Product: Compare how well different pages turn visits into purchases.
- Traffic-to-Cart Ratio: See if visitors who view a product actually add it to their cart.
- Influence of Descriptions and Images: Great copy and visuals can boost sales.
- A/B Testing: Try different layouts or calls to action to see what works best.
Collection and Category Analysis
- Performance by Collection: Group similar items and see which category is selling best.
- Navigation Patterns: Check how users move through your collections.
- Merchandising Strategy: Place high-margin or popular items in prominent positions.
- Product Relationships: Cross-promote items that naturally fit together.
Now you know which products to spotlight or improve. Next, let’s look at how to measure and optimize your marketing campaigns.
Marketing and Campaign Analysis
This section shows you how to measure the effectiveness of your marketing channels, promotions, and email campaigns.
Channel Performance
- Acquisition Channel Comparison: Find out if Facebook, Google, or email brings the most sales.
- ROAS (Return on Ad Spend): Compare revenue generated vs. money spent on ads.
- Organic vs. Paid Traffic: See which leads bring higher-quality visitors.
- Multi-Touch Attribution: Track how different marketing touches together lead to a sale.
Promotion Effectiveness
- Discount Codes: Track how many purchases used a specific code.
- Sales Lift: Compare normal sales vs. sales during promotions.
- Promotion Timing: Test different days or seasons to find the best response.
- Audience Response: Segment customers to see if certain groups love discounts more.
Email Marketing Performance
- Sales from Email Campaigns: Attribute revenue back to specific emails.
- Subscriber Engagement: Open rates, click-throughs, and unsubscribe data show email quality.
- Email Sequences: Optimize welcome series or drip campaigns for better results.
- Abandoned Cart Recovery: See how effective your reminder emails are.
You’re now measuring your marketing like a pro. But how do you turn these numbers into insights? Let’s talk about visualizing data.
Visualizing Shopify Data Effectively
Here, we’ll cover how to create dashboards, choose the right charts, and tell a clear story with your data.
Dashboard Creation
- Metric Organization: Group related metrics (sales, traffic, etc.) together for easier viewing.
- Chart Selection: Decide between line charts, bar charts, or tables based on the data type.
- Custom Dashboards: Tools like Google Data Studio can help you build shareable reports.
- Collaboration: Share dashboards with your team for aligned decision-making.
Effective Data Visualization
- Accuracy: Ensure your data is correct before making graphs.
- Intuitiveness: Readers should understand the chart at a glance.
- Engagement: Use visuals that capture attention without confusing people.
- Storytelling: Highlight the most important trend or insight so it’s clear.
Data Exploration Techniques
- Drill-Down Analysis: Click into a broad metric (like total sales) to see details (like product-level sales).
- Comparative Analysis: Compare this month’s performance with last month or last year.
- Time-Series Trends: Identify patterns (like weekend spikes or seasonal dips).
- Anomaly Detection: Watch for sudden changes that may indicate a problem or opportunity.
You’ve seen how to make data look great. Now, let’s learn how to structure your decisions using proven frameworks.
Implementing Decision-Making Frameworks
This part covers structured methods for turning data insights into concrete actions.
The DECIDE Model
- Define: State the issue clearly (e.g., “Cart abandonment is high.”)
- Explore: Gather data about the problem.
- Consider: Look at different solutions (change shipping cost, simplify checkout).
- Identify: Pick the best solution based on your data.
- Decide: Implement the solution.
- Evaluate: Track the results and refine if needed.
The ODC Model
Objectives, Data, Consequences is a simpler approach:
- Objectives: Set your main goal (increase average order value).
- Data: Gather relevant numbers (current AOV, typical add-ons).
- Consequences: Estimate outcomes (how changes in pricing or bundling might affect revenue).
Overcoming Analysis Paralysis
- Set Priorities: Focus on high-impact areas first.
- Balance Data with Gut Feel: Sometimes you won’t have perfect information—don’t let that stop you.
- Act Quickly: Small, fast experiments can provide valuable insights.
You now have frameworks for making sense of your findings. Next, we’ll explore advanced analytics strategies for deeper insights.
Advanced Analytics Strategies
If you’re ready to go beyond the basics, these methods can help you forecast, segment, and refine your customer experience even more.
Cohort Analysis
- Customer Cohorts: Group shoppers by the month they made their first purchase, for example.
- Retention and LTV by Cohort: See if more recent cohorts spend more over time.
- Channel Quality: Compare which acquisition channel brings long-term, high-value customers.
- Product Adoption Patterns: Track how quickly new products catch on in each cohort.
Predictive Analytics
- Inventory Forecasting: Use past sales data to predict future stock needs.
- Churn Prediction: Identify customers at risk of leaving so you can re-engage them.
- LTV Projection: Estimate how much value you can expect from different segments.
- Demand Planning: Plan marketing campaigns around predicted high-volume periods.
Customer Segmentation
- RFM Analysis: Groups customers by Recency, Frequency, and Monetary value.
- Behavioral Segmentation: Segment based on shopping habits like average order size or categories visited.
- Personalization: Send targeted emails or show tailored product recommendations.
- Segment-Specific Marketing: Each group might respond best to different offers or messages.
You’re now well-versed in advanced tactics. Let’s see how to build a culture in your organization that loves data and keeps optimizing.
Building a Data-Driven Culture
In this part, discover how to get your entire team on board with data-driven processes and reporting.
Team Structure and Responsibilities
- Data Roles: Ensure you have someone who can analyze and interpret reports.
- Training: Offer workshops or online courses to improve analytics skills.
- Collaboration: Encourage marketing, sales, and customer service to share data insights.
- Knowledge Sharing: Keep a common repository or dashboard so everyone sees the same metrics.
Regular Reporting Cadence
- Reporting Schedules: Set up weekly, monthly, or quarterly reviews.
- Functional Differences: Different teams need different data (marketing vs. inventory management).
- Automation: Automate recurring reports to save time.
- Metrics Review Meetings: Discuss changes in KPIs and propose solutions.
Testing and Optimization Culture
- A/B Testing: Continuously experiment with site design and marketing messages.
- Data-Based Hypotheses: Base your tests on observed issues or opportunities.
- Ongoing Improvement: Tweak and refine after each test for incremental gains.
- Celebrate Wins: Share success stories to motivate the team.
You’ve set the stage for a data-driven team. Now, let’s see some real-world examples that show the power of data-based decisions.
Case Studies and Examples
Here, we’ll look at how successful Shopify stores used analytics to make major improvements, plus industry-specific tips.
Success Stories
- Case Study #1: One store found that most cart abandonments happened at shipping options. They simplified shipping to increase conversion by 20%.
- Case Study #2: Another business tracked time-of-day sales data and discovered a surge in evening purchases, so they ran ads at night for higher returns.
- Key Lessons: Always check your funnel for friction points and look for patterns in your data.
Industry-Specific Analytics Approaches
- Fashion Stores: Analyze returns closely. Clothing fit issues often lead to high return rates.
- Electronics: Customers might spend more time researching before buying, so track multi-visit conversions.
- B2B vs. B2C: B2B often involves longer sales cycles, so track lead nurturing carefully.
- Niche Businesses: In small niches, every customer matters—watch for subtle shifts in their habits.
These examples show the difference data can make. Finally, let’s look at future trends so you can stay ahead of the curve.
Future Trends in Shopify Analytics
In this final content section, we’ll explore upcoming technologies and privacy considerations that might impact how you handle data.
Emerging Technologies
- AI and Machine Learning: Automates predictions and personalized recommendations.
- Predictive Analytics: Helps you forecast demand, plan inventory, and adjust pricing in real-time.
- Personalization Advances: Dynamic landing pages and product suggestions based on browsing history.
- Shopify’s Future Features: Expect more built-in analytics tools as Shopify evolves.
Privacy and Compliance Considerations
- Data Regulations: Laws like GDPR or CCPA may affect how you collect and store customer data.
- First-Party Data: Rely more on data you gather directly from your store, rather than cookies.
- Cookie-Less Tracking: New ways to measure user behavior without traditional cookies.
- Ethical Analysis: Respect customer privacy and be transparent about data usage.
You’ve got an eye on the future. Let’s wrap it all up and see how you can begin applying these insights today!
Conclusion
Analyzing your Shopify data is like getting a clear roadmap to profitable growth. By tracking essential metrics, studying customer behavior, and using decision-making frameworks, you’ll uncover exactly what your business needs to thrive. Remember, analytics is an ongoing process. Keep experimenting, refining, and learning from your data, and you’ll stay one step ahead in a competitive marketplace.
Quick Note: Looking for a simple way to boost your Shopify store’s sales? Check out Growth Suite. It helps automate marketing campaigns, track key metrics, and give your store a revenue boost—no heavy lifting required!
References
- Moldstudy. (2024, November 11). Overcoming Analysis Paralysis: Making Data-Driven Decisions in Shopify Development.
- Datazen. (2022, January 1). Unlocking the Power of Shopify Analytics: Making Data-Driven Decisions for Your Store.
- Conversios. (2024, October 3). The Right Way to Optimize Shopify Metrics with Conversios App.
- Panoply Blog. (2024, May 10). Best Shopify Analytics Tools: Top Picks for Data Insights.
- Shopify Polaris. (2017, January 1). Data visualizations – Shopify Polaris.
- Shopify. (2024, August 30). Ecommerce Performance Analysis: Metrics and KPIs to Measure.
- BotPenguin. (2025, March 3). Shopify Analytics: Key Metrics and Best Practices.
- Integrate.io. (2023, February 3). Extracting and Visualizing your Shopify Data (Part 1).
- Shopify Help Center. (n.d.). Reports – Shopify Help Center.
- Coupler.io Blog. (2025, February 14). Shopify Analytics: a Guide to Analyzing Data for E-commerce Success.