
Did you know that while average Shopify stores convert at just 1-3%, top performers achieve 3.2% or higher? What’s their secret? They don’t rely on hunches—they follow the data.
In this comprehensive guide, you’ll learn:
- How to set up the right analytics to track what really matters
- Proven strategies to find and fix conversion bottlenecks
- Step-by-step A/B testing frameworks that eliminate guesswork
- Advanced techniques used by top-performing Shopify stores
Ready to transform your store with data that actually drives decisions? Let’s dive in!
Understanding the Foundations of Data-Driven CRO
Before jumping into tactics, we need to understand what makes data-driven CRO different from random optimization attempts. In this section, we’ll build your foundation for success.
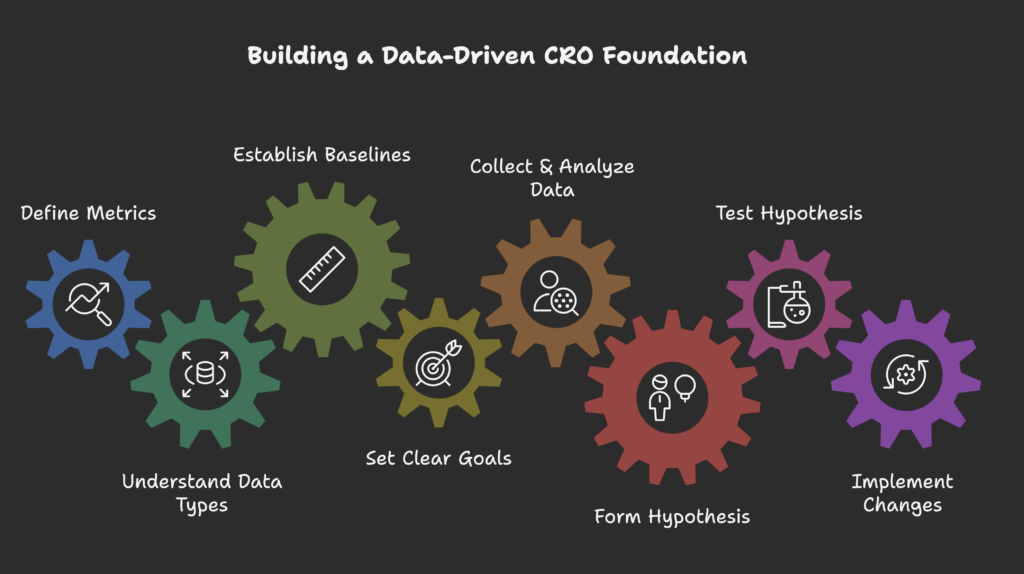
Data-driven CRO means making changes based on evidence rather than assumptions. It transforms the common “I think this will work” approach into “I know this works because the data proves it.”
To build this foundation, you’ll need to:
- Define key conversion metrics – Beyond overall conversion rate, track add-to-cart rate, checkout completion, and average order value
- Understand data types – Quantitative data (numbers and statistics) tells you what’s happening; qualitative data (feedback and observations) tells you why
- Establish baselines – Know your starting point for all metrics before making changes
- Set clear goals – Define specific, measurable targets (e.g., “increase checkout completion by 15%”)
The best CRO strategies follow a scientific approach:
- Collect and analyze data
- Form a hypothesis based on findings
- Test the hypothesis with controlled changes
- Measure results against your baseline
- Implement successful changes and repeat
Without this structured approach, you might make changes that feel right but actually harm conversions. Remember that even small improvements compound—a 0.5% conversion increase can mean thousands in additional revenue.
Now that you understand the importance of data-driven decision making, let’s explore how to build the analytics infrastructure that makes it all possible. Ready to set up your CRO command center?
Essential Analytics Infrastructure for Shopify CRO
Think of analytics as the radar system for your Shopify store. Without it, you’re flying blind. In this section, we’ll build your analytics stack to capture every important customer interaction.
Start with these essential tools and integrations:
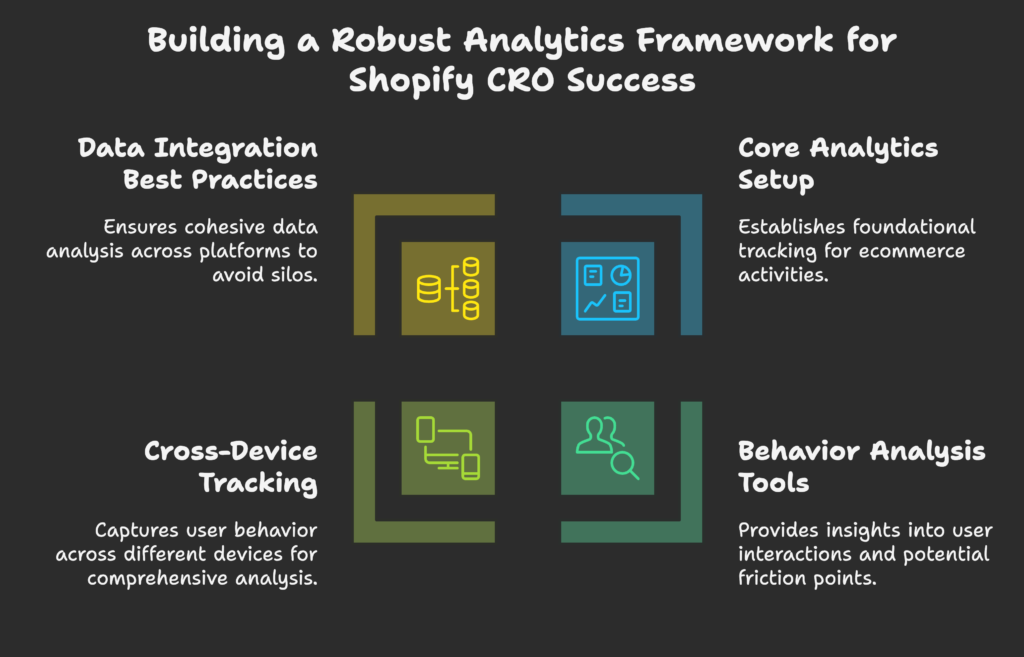
Core Analytics Setup
- Google Analytics with Enhanced Ecommerce – Configure to track the complete purchase funnel from product views to transactions
- Shopify Analytics – While limited compared to GA, it provides valuable store-specific metrics and should be configured properly
- Tag Manager – Implements tracking codes without technical hassle and makes future changes easier
Behavior Analysis Tools
- Heatmaps – Visualize exactly where users click, move, and scroll on your pages
- Session recordings – Watch real users navigate your store to spot confusion and friction
- Form analytics – Identify which checkout fields cause abandonment
Cross-Device Tracking
With over 70% of Shopify traffic coming from mobile devices, you need:
- Separate mobile conversion funnel analysis
- Cross-device journey tracking to understand multi-device shopping patterns
Privacy tip: Always ensure your analytics setup complies with GDPR, CCPA, and other relevant privacy regulations. Implement proper consent mechanisms and anonymize data where required.
Data Integration Best Practices
To avoid data silos, create a unified view by:
- Using consistent UTM parameters across marketing channels
- Implementing unique customer identifiers across platforms
- Creating custom dashboards that combine data from multiple sources
Once your analytics infrastructure is solid, you’ll begin collecting valuable data—but numbers alone aren’t enough. The real magic happens when you turn those numbers into meaningful customer segments that reveal hidden patterns. Ready to discover who your best customers really are?
Customer Data Segmentation and Analysis
Not all customers are created equal. Treating everyone the same leaves money on the table. In this section, we’ll slice your data to reveal insights about specific customer groups that can dramatically increase conversions.
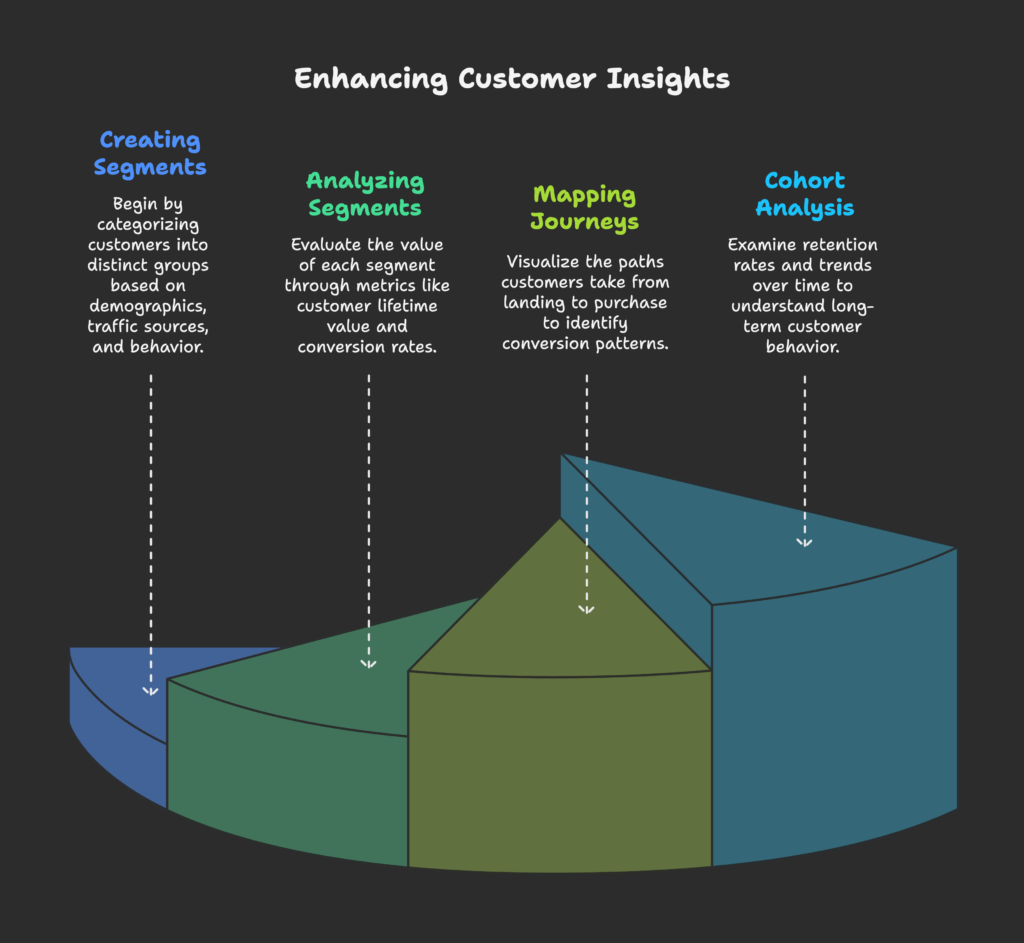
Creating Meaningful Customer Segments
Start by segmenting your analytics data by:
- Demographics – Age, gender, location, language
- Traffic sources – Direct, organic, paid, social, email
- Device types – Desktop, mobile, tablet
- Shopping behavior – First-time vs. returning, browsers vs. buyers
- Purchase history – Order value, frequency, product categories
High-Value Segment Analysis
Identify your most valuable customer segments by:
- Calculating customer lifetime value (CLV) for each segment
- Analyzing conversion rates across different segments
- Determining which segments have the lowest acquisition costs
For example, you might discover that customers from Instagram convert at 2x your average rate, or that customers who buy a specific product category return more frequently.
Journey Mapping with Data
Use your analytics to visualize how different segments move through your store:
- Map typical paths from landing to purchase for high-converting segments
- Identify where low-converting segments drop off
- Compare browsing patterns between converters and non-converters
Cohort Analysis for Retention Insights
Group customers by when they first purchased to:
- Measure retention rates over time
- Spot trends in repeat purchase behavior
- Evaluate the long-term impact of your CRO changes
Pro tip: Don’t create too many segments. Focus on 3-5 key segments that represent significant portions of your traffic or revenue.
Now that you understand who your customers are and how they behave differently, it’s time to put that knowledge to work by conducting a comprehensive audit of your Shopify store. Ready to uncover the hidden conversion killers that have been costing you sales?
Comprehensive Shopify Store Audit
A data-driven store audit reveals exactly what’s working and what’s broken in your conversion funnel. In this section, we’ll systematically examine your store through the lens of your analytics data to find your biggest opportunities.
Technical Performance Assessment
Use your analytics to evaluate:
- Page load times – Identify pages that load slowly (anything over 3 seconds hurts conversions)
- Mobile responsiveness – Check conversion rates across devices to spot mobile-specific issues
- Error rates – Find pages with JavaScript errors or 404s that frustrate users
UX Evaluation Based on Behavior Data
Analyze heatmaps and session recordings to find:
- Elements users try to click that aren’t clickable
- Important buttons that get ignored
- Content that users scroll past without engaging
- Navigation paths that differ from your intended user flow
Conversion Funnel Analysis
Map your complete conversion funnel to identify:
- Funnel leakage points – Pages with unusually high exit rates
- Abandoned cart patterns – Products or checkout steps with high abandonment rates
- Cross-device friction – Where users switch devices and often drop off
Competitive Benchmarking
Compare your metrics against industry standards:
- Average conversion rate for your product category
- Typical cart abandonment rates in your industry
- Standard page load times for successful stores
Prioritizing Opportunities
After your audit, prioritize issues based on:
- Potential impact – Estimated revenue increase if fixed
- Implementation effort – Resources required to address the issue
- Testing feasibility – How easily you can test potential solutions
Your audit will generate dozens of potential improvements. Don’t try to fix everything at once! Instead, develop a prioritized list of data-backed hypotheses to test methodically. Speaking of testing, are you ready to learn how to set up A/B tests that actually deliver meaningful results?
A/B Testing Framework for Shopify
Guessing is gambling with your revenue. A/B testing eliminates guesswork by scientifically comparing versions of your store to see which performs better. In this section, we’ll build a testing framework that delivers statistically valid results you can trust.
Setting Up Your Testing Program
Start with these essentials:
- Testing tool selection – Choose a tool compatible with Shopify (like Google Optimize, VWO, or Convert)
- Hypothesis documentation – Create a structured format to record what you’re testing and why
- Success metric definition – Determine primary and secondary conversion metrics for each test
Test Planning and Statistical Validity
Ensure reliable results by calculating:
- Required sample size – Use a sample size calculator based on your current conversion rate and desired confidence level
- Test duration – Calculate how long to run tests based on your traffic and calculated sample size
- Traffic allocation – Determine what percentage of visitors to include in your test
Common mistake: Ending tests too early. Most tests need at least 1-2 weeks and hundreds of conversions per variation to reach statistical significance.
Test Prioritization Framework
Use the PIE framework to prioritize tests:
- Potential – Estimated improvement in conversion
- Importance – Traffic to the page or element
- Ease – How quickly and simply you can implement the test
Common A/B Testing Approaches for Shopify
- Simple A/B tests – Testing one element against a variation (e.g., button color or headline)
- Split URL tests – Testing completely different page designs or layouts
- Multivariate tests – Testing multiple elements simultaneously (requires high traffic)
Interpreting Results Correctly
To avoid false conclusions:
- Wait for statistical significance (usually 95% confidence or higher)
- Run tests for complete business cycles (minimum one week)
- Look beyond the primary metric to secondary effects
- Segment results to see if the impact varies by user group
With your testing framework in place, it’s time to apply it to the most critical pages in your conversion funnel. Let’s start with the product page—where browsers turn into buyers and the real money is made!
Product Page Optimization Strategies
Product pages are your digital salespeople. They either convince visitors to buy or send them running to competitors. In this section, we’ll use data to transform your product pages into conversion powerhouses.
Data-Driven Product Image Optimization
Use heatmaps and A/B tests to:
- Determine optimal number of product images (typically 3-7 converts best)
- Test image types (lifestyle vs. product-only, angles, contexts)
- Optimize zoom functionality based on user engagement data
Product Description Effectiveness
Analyze user behavior to improve descriptions:
- Track scroll depth to see if users read your entire description
- A/B test different formats (bullet points vs. paragraphs)
- Test benefit-focused vs. feature-focused language
Call-to-Action Optimization
Test these critical CTA elements:
- Button text – “Add to Cart” vs. “Buy Now” vs. benefit-focused text
- Button placement – Above fold vs. after description
- Button design – Size, color, shape based on heatmap data
- Mobile-specific CTAs – Sticky buttons, size adjusted for touch
Social Proof Implementation
Measure the impact of:
- Review placement and format
- Review count visibility (“243 five-star reviews”)
- User photos in reviews vs. text-only
- “Customers also bought” recommendations
Cross-Sell and Upsell Optimization
Use purchase data to:
- Identify high-converting product combinations
- Test placement of related products (below vs. side vs. pop-up)
- Optimize bundle pricing and presentation
Pro tip: Mobile product pages need special attention. Analysis often shows that elements that work well on desktop can create friction on mobile.
Your product pages may be optimized, but that’s only half the battle. Even with the perfect product page, many customers abandon during checkout. Let’s fix that by diving into checkout optimization that keeps customers completing their purchases!
Checkout Process Optimization
The checkout is the final hurdle between browsing and buying. Even small improvements here directly impact your bottom line. Let’s use data to create a frictionless path to purchase.
Checkout Funnel Analysis
Start by mapping the complete checkout process:
- Analyze each step’s drop-off rate to identify problem areas
- Compare completion rates across devices and browsers
- Measure time spent on each checkout step to spot confusion
Form Field Optimization
Use form analytics to:
- Identify fields with high error rates or hesitation time
- Test reducing required fields (each additional field can reduce conversions by 7%)
- Optimize field order based on user behavior
- A/B test inline validation vs. post-submission validation
Payment Method Optimization
Analyze payment data to:
- Identify most-used payment methods by customer segment
- Test payment method display order and visual prominence
- Measure conversion lift from adding alternative payment options (Apple Pay, Shop Pay, etc.)
Shipping Options Presentation
Test these shipping-related elements:
- Free shipping thresholds and messaging
- Shipping cost display timing (early vs. late in checkout)
- Estimated delivery date visibility and format
Cart Abandonment Recovery
Implement and measure:
- Exit-intent popups with incentives (10-15% recovery rate typical)
- Abandoned cart emails with varied timing and content
- Cart persistence across sessions and devices
Guest Checkout vs. Account Creation
Use data to optimize:
- Guest checkout flow (reducing friction vs. capturing customer data)
- Post-purchase account creation offers
- Social login effectiveness by platform
Trust signals matter: Analysis typically shows that prominent security badges and guarantees near checkout buttons can increase conversions by 15-20%.
With a streamlined checkout, your funnel’s efficiency improves dramatically. But want to know what separates good stores from great ones? It’s understanding the psychological triggers that drive purchase decisions. Let’s explore how data can validate which psychological principles actually work for your specific customers.
Leveraging Psychological Triggers with Data Validation
Psychology drives purchasing decisions, but not all psychological triggers work equally well for all products or customers. In this section, we’ll use data to identify which psychological principles actually move your conversion needle.
Scarcity and Urgency Testing
Measure the effectiveness of:
- Inventory counters – “Only 3 left in stock” messaging
- Time-limited offers – Countdown timers for sales
- Limited editions – Exclusive or time-bounded products
The data often shows effectiveness varies dramatically by product type and price point. A/B test these elements with different customer segments.
Social Proof Optimization
Test and measure different types:
- User reviews – Position, quantity, and format
- Purchase notifications – “Sarah from Boston just bought this”
- Usage statistics – “Joined by 10,000+ customers”
- Expert endorsements – Professional recommendations
Price Anchoring Strategies
Use A/B testing to validate:
- Original price display alongside sale price
- Premium option placement to make middle-tier look attractive
- Bundle pricing psychology (e.g., “Get X free when you buy Y”)
FOMO (Fear of Missing Out) Tactics
Measure the conversion impact of:
- Recently viewed/sold notifications
- Limited-time shipping offers
- “Back in stock” notifications and waitlists
Trust-Building Elements
Test the effectiveness of:
- Money-back guarantee positioning and wording
- Security badge placement near checkout buttons
- Customer support availability indicators
Important note: Different psychological triggers work better for different products and price points. Low-cost impulse purchases respond well to urgency, while high-value items benefit more from trust signals and social proof.
Psychology works even better when it’s personalized to each visitor. Ready to discover how top-performing stores use data to create unique experiences for different customer segments? Let’s explore the power of personalization!
Advanced Personalization Through Data
Generic experiences produce average results. Personalization can increase conversion rates by 20% or more by making each visitor feel the store was designed just for them. Let’s see how to use your customer data to create tailored shopping experiences.
Behavioral-Based Product Recommendations
Implement and measure:
- Recently viewed products with conversion tracking
- “Customers who bought this also bought” recommendations based on purchase data
- Browsing pattern-based suggestions
Customer Segment Personalization
Create tailored experiences for:
- New visitors – First-time offers, simplified navigation
- Returning non-buyers – Targeted incentives based on previous browse behavior
- Previous customers – Replenishment reminders, loyalty rewards
- High-value segments – Premium offers, early access to new products
Geographic and Contextual Personalization
Test location-based customization:
- Currency and language automatic switching
- Weather-appropriate product highlighting
- Local shipping estimates and delivery options
- Regional promotions and messaging
Personalized Email Marketing Integration
Measure effectiveness of:
- Browse abandonment emails with viewed products
- Post-purchase recommendations based on order history
- Lifecycle-stage appropriate messaging
Dynamic Landing Pages
Create and test:
- Traffic source-specific landing pages (e.g., different for Facebook vs. Google)
- Return visitor recognition with continued journey options
- Campaign-specific content that maintains message consistency
The right balance: Data shows that while personalization improves conversion, too much can feel intrusive. Test to find the perfect balance for your brand and products.
With personalization in place, you’re providing a superior desktop experience. But what about the majority of your visitors who shop on mobile? Let’s optimize the mobile experience to capture that growing segment of shoppers!
Mobile Optimization Through User Behavior Analysis
Mobile shoppers now represent 70-80% of traffic for many Shopify stores, yet they often convert at half the rate of desktop users. This section will help you close that gap by optimizing specifically for mobile behavior patterns.
Mobile-Specific User Behavior Analysis
Use mobile analytics to understand:
- Typical mobile session duration (usually 40-60% shorter than desktop)
- Mobile navigation patterns and common touch targets
- Mobile-specific exit points and friction areas
Touch Heatmap Optimization
Analyze touch heatmaps to:
- Identify mistouched elements and accidental taps
- Optimize button size and spacing for thumbs (minimum 44x44px)
- Place key elements in the “thumb zone” of mobile screens
Mobile Page Speed Improvement
Mobile users abandon after just 3 seconds of loading time. Measure and improve:
- Image compression for mobile bandwidth
- Mobile-specific asset loading strategies
- Critical rendering path optimization
Mobile-First Content Presentation
Test and optimize:
- Content prioritization (what appears above the fold on mobile)
- Collapsible sections for lengthy content
- Mobile-friendly product image galleries
- Simplified navigation for smaller screens
Mobile Checkout Simplification
Based on mobile completion data:
- Reduce form fields to the absolute minimum
- Implement mobile wallet payments prominently
- Use appropriate keyboard types for input fields
- Create single-screen checkout processes where possible
Did you know? Optimizing your mobile checkout alone can increase overall conversion rates by 15-30% for most Shopify stores.
Your store structure is now optimized for both desktop and mobile, but what about the words and images that actually sell your products? Let’s explore how to create content that converts based on real user data!
Data-Driven Content and Messaging
Even the best store structure fails without compelling content. In this section, we’ll use data to craft product descriptions, images, and messaging that actually drive purchases rather than just filling space.
Value Proposition Testing
Use A/B testing to optimize:
- Homepage headline variations
- Product page main benefit statements
- Unique selling proposition visibility and placement
Copy Optimization Based on Data
Analyze and improve:
- Product description length (data often shows shorter converts better on mobile)
- Readability scores correlated with conversion
- Technical vs. benefit-focused language effectiveness
- Question-addressing content based on customer support data
Visual Content Performance Analysis
Measure engagement with:
- Product image types (lifestyle vs. detailed product shots)
- Product video conversion impact
- Infographic effectiveness for complex products
- User-generated content vs. professional photography
Email Marketing Content Optimization
Test and measure:
- Subject line performance across segments
- Email content length and format
- Call-to-action placement and wording
- Image-to-text ratios
User-Generated Content Effectiveness
Analyze the conversion impact of:
- Customer photos in reviews
- Testimonial placement and format
- Instagram feed integration
- Customer story highlighting
Content insight: Data consistently shows that addressing specific customer objections in your content can increase conversions by 15-20%.
Great content deserves a fast, smooth technical foundation. Let’s make sure your store’s technical performance isn’t silently killing your conversion rate!
Technical Optimization for Conversion
Technical issues can sabotage even the best marketing efforts. Studies show that 40% of visitors abandon a site that takes more than 3 seconds to load. In this section, we’ll use performance data to create a lightning-fast shopping experience.
Page Speed Optimization
Analyze and improve:
- Image size and format optimization (WebP typically reduces size by 25-35%)
- CSS and JavaScript minification and compression
- Server response time improvement
- Critical rendering path optimization
Mobile Performance Enhancement
Focus on mobile-specific improvements:
- Accelerated Mobile Pages (AMP) implementation where appropriate
- Mobile-optimized image delivery
- Touch response optimization (maximum 100ms delay)
Technical SEO for Conversion
Improve searchability and performance:
- Schema markup for rich results
- Site structure optimization for crawlability
- Internal linking improvements
- Structured data implementation
App Assessment and Optimization
Evaluate the performance impact of:
- Installed Shopify apps (remove unnecessary ones)
- Third-party scripts and their loading order
- App conflicts and redundancies
Technical insight: A 1-second improvement in page load time can increase conversions by 7% or more, according to multiple studies.
With technical foundations strengthened, let’s turn to one of the most valuable but often overlooked data sources: direct customer feedback. What are your customers trying to tell you about their shopping experience?
Customer Feedback Integration
Quantitative data tells you what’s happening, but qualitative feedback tells you why. In this section, we’ll explore how to systematically collect and analyze customer insights to inform your CRO strategy.
Structured Feedback Collection
Implement and analyze:
- Post-purchase satisfaction surveys
- Abandoned cart feedback requests
- On-site feedback widgets at key journey points
- Net Promoter Score (NPS) tracking
Survey Design Optimization
Create effective feedback mechanisms:
- Keep surveys short (3-5 questions maximum)
- Include both closed and open-ended questions
- Time surveys appropriately in the customer journey
- Offer incentives for completion when appropriate
Qualitative Data Analysis
Extract actionable insights from:
- Common themes in open-ended responses
- Sentiment analysis of customer comments
- Specific product feedback patterns
- Feature requests and improvement suggestions
User Testing Sessions
Conduct and analyze:
- Moderated user testing with typical customers
- Task completion success rates
- Observed confusion points and workarounds
- Verbal feedback during shopping tasks
Customer Support Integration
Mine insights from:
- Common support ticket themes
- Live chat transcripts for friction points
- Support agent feedback on customer struggles
- Questions asked before purchase
Feedback insight: The most valuable customer feedback often comes from recent non-converters who can articulate exactly what prevented their purchase.
With all this data and insight, you need a structured plan to implement changes. Let’s create a roadmap that will guide your optimization efforts for maximum impact!
Building a Data-Driven Testing Roadmap
Random testing leads to random results. A structured roadmap ensures you tackle the highest-impact opportunities first and build on what you learn. Let’s create your strategic plan for continuous improvement.
Opportunity Prioritization
Rank potential improvements using:
- Potential impact – Estimated conversion lift × traffic × average order value
- Implementation complexity – Resources and time required
- Test confidence – How strongly data supports the hypothesis
Quick Wins vs. Strategic Tests
Balance your roadmap with:
- Quick wins – High impact, low effort improvements (e.g., button text, headline changes)
- Strategic tests – Fundamental UX improvements that may take longer but have lasting impact
- Iterative tests – Series of incremental improvements to a single element
Structured Documentation
Create standardized documentation for each test:
- Clear hypothesis statement
- Expected impact and reasoning
- Success metrics and evaluation criteria
- Implementation requirements and timeline
- Results and learnings (after completion)
Testing Calendar Development
Create a realistic schedule considering:
- Traffic requirements for statistical significance
- Seasonal traffic variations
- Development and design resource availability
- Business cycle and promotional calendar
Cross-Functional Collaboration
Ensure testing success by involving:
- Marketing team for messaging and promotion coordination
- Design team for visual implementation
- Development team for technical execution
- Customer service for feedback collection
Planning insight: Successful CRO programs typically run 2-4 meaningful tests per month and find significant wins in about 1 of 3 tests.
With your roadmap in place, you need to know whether all this effort is paying off. Let’s explore how to measure the true success of your CRO program beyond just conversion rate!
Measuring CRO Program Success
A successful CRO program delivers more than just a higher conversion rate—it creates lasting business impact. In this section, we’ll define how to measure the comprehensive success of your optimization efforts.
Core Success Metrics
Track these primary indicators:
- Overall conversion rate – By segment, device, and traffic source
- Revenue per visitor – Often more important than conversion rate alone
- Average order value – Measures upsell/cross-sell effectiveness
- Repeat purchase rate – Indicates customer satisfaction with first purchase
ROI Calculation
Determine program value by measuring:
- Additional revenue generated from conversion improvements
- Program costs (tools, resources, agency fees if applicable)
- Long-term customer value impact from improved experience
Attribution and Impact Assessment
Properly attribute results by:
- Isolating CRO impact from marketing campaign changes
- Accounting for seasonal variations in performance
- Considering market condition changes
Learning Value Assessment
Measure knowledge gained beyond direct revenue impact:
- Customer insight quality and actionability
- Failed test learning value
- Application of insights to other channels
Reporting Framework Development
Create stakeholder-appropriate reporting:
- Executive dashboards with business impact metrics
- Detailed test results documentation
- Learning library of all tests and outcomes
- Regular program performance reviews
Success insight: The most successful CRO programs show an ROI of 5-10x or more on program investment within 6-12 months.
For those ready to push beyond the basics, let’s explore advanced analytics techniques that can take your CRO program to the next level!
Advanced Analytics Techniques for Shopify CRO
Basic analytics tells you what happened. Advanced analytics predicts what will happen and why. In this section, we’ll explore sophisticated techniques that reveal deeper insights for mature CRO programs.
Predictive Analytics Implementation
Use advanced forecasting to:
- Predict which visitors are likely to convert
- Identify customers at risk of churning
- Forecast inventory needs based on browsing patterns
- Anticipate seasonal conversion pattern changes
Machine Learning Applications
Implement AI-driven optimization:
- Automated content personalization based on visitor behavior
- Dynamic pricing optimization by customer segment
- Product recommendation algorithm refinement
- Conversion probability scoring to target abandonment prevention
Advanced Attribution Modeling
Move beyond last-click attribution:
- Multi-touch attribution across marketing channels
- Time-decay models that factor the customer journey
- Cross-device attribution for complete path analysis
Cohort Analysis Techniques
Gain deeper customer insights through:
- Acquisition source cohort performance comparisons
- Feature adoption impact on retention by cohort
- Lifetime value modeling by acquisition period
Customer Lifetime Value Optimization
Focus on long-term value by analyzing:
- First purchase indicators of high LTV customers
- Product category correlation with repeat purchase behavior
- Optimal repurchase timing by product type
Advanced insight: Stores using machine learning for personalization typically see 30-40% higher customer lifetime value compared to those using basic segmentation.
Theory is helpful, but nothing beats real-world examples. Let’s look at actual case studies of Shopify stores that transformed their results with data-driven CRO!
Case Studies: Data-Driven CRO Success Stories
Success leaves clues. In this section, we’ll examine real Shopify stores that achieved remarkable results through data-driven optimization, providing actionable lessons you can apply to your own store.
Small Business Transformation
Case: Handmade Soap Boutique
- Challenge: 1.2% conversion rate despite high-quality products
- Data insight: Heatmaps revealed customers weren’t scrolling to see product benefits
- Solution: Restructured product pages with benefits above the fold
- Result: 83% conversion increase and 26% higher average order value
Mobile Optimization Impact
Case: Athletic Apparel Brand
- Challenge: Mobile conversion rate 70% lower than desktop
- Data insight: Mobile checkout completion analysis showed form friction
- Solution: Simplified mobile checkout and added Apple/Google Pay
- Result: 115% increase in mobile conversion rate
Psychological Trigger Testing
Case: Home Decor Retailer
- Challenge: High cart abandonment on premium products
- Data insight: Survey data showed price concern was main objection
- Solution: Tested free shipping threshold messaging and installment payment options
- Result: 42% decrease in cart abandonment
Personalization Implementation
Case: Specialty Food Store
- Challenge: Low repeat purchase rate despite high satisfaction
- Data insight: Purchase interval analysis showed product-specific replenishment patterns
- Solution: Implemented personalized replenishment reminder emails
- Result: 64% increase in repeat purchases within 90 days
Learning from Failure
Case: Fashion Accessories Store
- Challenge: Attempted site redesign based on competitor analysis
- What went wrong: Didn’t validate changes with existing customer data
- Lesson learned: Implemented A/B testing program before major changes
- Result: Incremental approach led to 28% conversion improvement vs. 12% drop from full redesign
Case study insight: The most successful CRO programs share one trait—they make decisions based on their own customer data rather than industry “best practices” alone.
As we look to the future, how will data-driven CRO evolve? Let’s explore emerging trends that will shape the next generation of Shopify optimization!
Future Trends in Data-Driven Shopify CRO
The world of ecommerce optimization evolves rapidly. Staying ahead means anticipating emerging technologies and methods. Here’s what forward-thinking Shopify merchants should prepare for.
AI and Machine Learning Integration
Expect these advancements:
- Real-time personalization based on browsing intent
- Dynamic pricing optimization by customer segment and behavior
- Predictive abandonment prevention with targeted interventions
- Automated content generation optimized for conversion
Visual Commerce Optimization
Preparing for visual-first shopping:
- Augmented reality product visualization optimization
- Visual search capability and optimization
- Video commerce conversion optimization
- Interactive product exploration analytics
Voice Commerce Readiness
Optimizing for voice-driven shopping:
- Voice search optimization strategies
- Voice-assisted shopping conversion tracking
- Voice-specific conversion paths and analysis
Privacy-First Analytics
Adapting to a cookieless future:
- First-party data collection and activation
- Privacy-preserving analytics techniques
- Zero-party data strategies (directly provided by customers)
- Consent-based personalization approaches
Omnichannel Optimization
Breaking down channel silos:
- Unified customer journey analytics across channels
- Online-to-offline behavior tracking and optimization
- Cross-platform experience consistency measurement
- Marketplace integration and optimization
Future insight: The most successful Shopify merchants will be those who balance automation and AI capabilities with authentic human elements that build genuine customer connections.
As we’ve explored every aspect of data-driven CRO for Shopify, let’s bring it all together with actionable next steps to implement your own optimization program!
Conclusion
Data-driven CRO isn’t just about increasing conversion rates—it’s about creating a better shopping experience that naturally leads to more sales. By following the framework outlined in this guide, you’ll move from making gut-based decisions to implementing strategic improvements backed by real customer data.
Remember these key principles as you build your CRO program:
- Start with proper measurement – You can’t improve what you don’t track
- Follow the scientific method – Form hypotheses based on data, not opinions
- Prioritize based on impact – Focus on changes that affect important pages and conversion steps
- Test methodically – Ensure statistical validity before implementing changes
- Learn from every test – Even “failed” tests provide valuable customer insights
- Think long-term – CRO is a continuous program, not a one-time project
Your implementation roadmap should follow this sequence:
- Set up proper analytics infrastructure
- Establish baseline metrics across key conversion points
- Conduct a comprehensive data-driven store audit
- Create a prioritized testing roadmap
- Implement your testing program with proper documentation
- Measure results and continuously refine your approach
Remember that even small improvements compound over time. A series of 5-10% gains quickly multiplies into transformative results for your business.
Quick reminder: Shopify merchants can accelerate their growth journey with the Growth Suite application, which offers integrated tools for analytics, A/B testing, and optimization in one convenient package.
References
- Selectika. (2025, February 18). Understanding Statistical Significance In E-commerce
- Conversionsciences. (2025, February 9). A/B Testing Guide: The Proven 6-Step Process for Higher Conversions
- Ecomexperts.io. (2024, September 25). Leveraging A/B Testing to Improve Shopify Store Performance
- ConvertMate. (2025, February 15). Shopify A/B Testing: Top Strategies You Must Know
- Toptal. (2025, March 13). 12 Conversion Rate Optimization Tactics for your Shopify Store
- Shopify. (2024, August 5). CRO Analytics: 6 Conversion Reports To Follow
- Instant. (2025, March 4). 22 Practical tips for Shopify conversion rate optimization
- Indigo.ai. (2025, March 6). How to Increase Your Shopify Conversion Rate: Tips and Best Practices
- FirstPier. (2023, August 15). Shopify CRO Strategies: Boost Your Conversion Rate Like an Expert
- Ecorn Agency. (2025, January 20). Shopify Conversion Rate Optimization: Proven Strategies That Drive Growth
- BlueTuskr. (2025, January 7). Shopify CRO Best Practices: Identify and Fix Conversion Bottlenecks