
Imagine you’re watching your Shopify store grow month after month. Sales are coming in, but something feels off. Some customers buy once and disappear, while others keep coming back like old friends. What makes the difference? The answer lies in understanding not just who your customers are, but how their behavior changes over time.
That’s where cohort analysis comes in – a powerful but often overlooked tool that can transform how you understand your customer relationships.
By the time you finish reading this article, you’ll know:
- How to group your customers in meaningful ways to spot patterns
- Which metrics actually matter for long-term growth
- Step-by-step instructions for running your own cohort analysis
- Practical ways to use these insights to boost your retention and profits
Ready to unlock the hidden story your sales data is trying to tell you? Let’s dive in!
Introduction to Cohort Analysis in E-commerce
Ever gathered with friends from your graduation year for a reunion? That’s essentially what cohort analysis does with your customers – it groups them based on shared experiences and watches how they behave over time.
At its core, cohort analysis is simply a way to group customers who share common characteristics – most commonly when they made their first purchase – and then track how these groups behave over time. Instead of looking at all your customers as one big pool, you’re organizing them into meaningful segments that reveal patterns that would otherwise remain hidden.
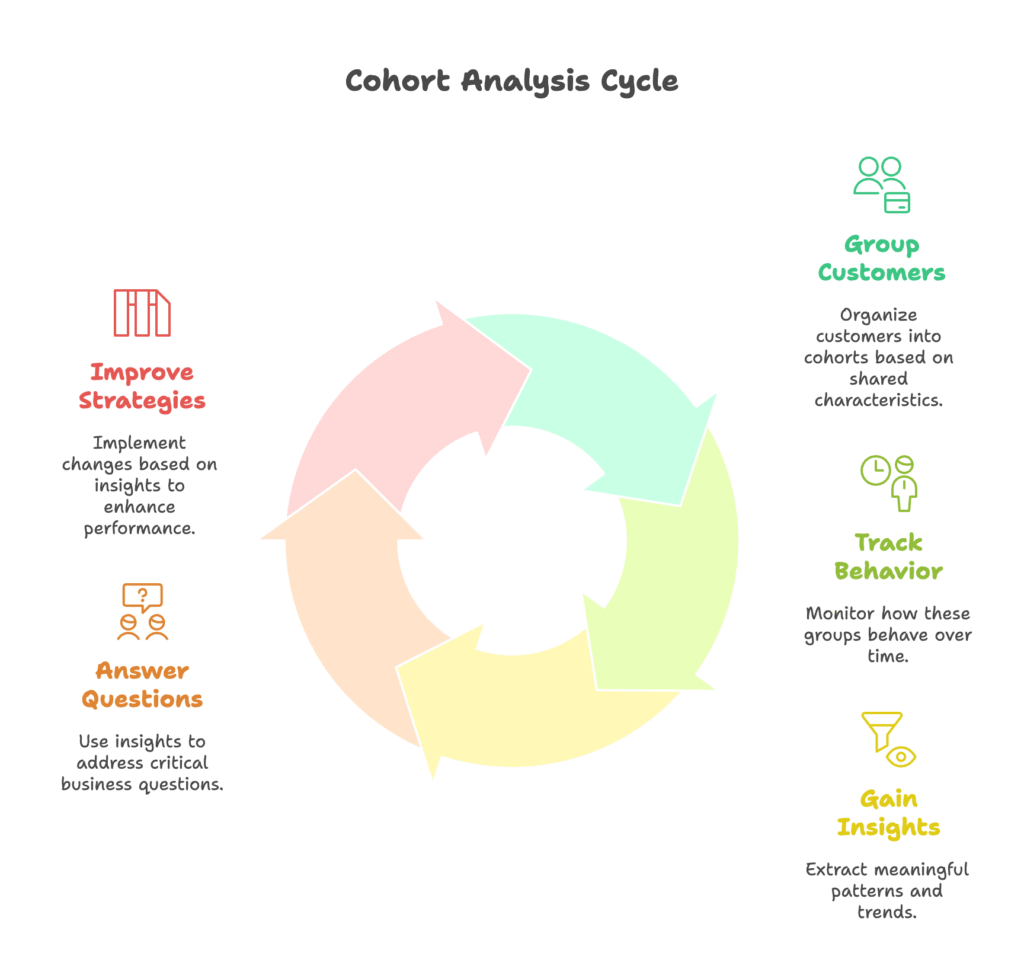
For Shopify store owners, this approach is game-changing. Traditional metrics like total sales or average order value only tell you what’s happening right now. But cohort analysis reveals the evolution of customer behavior – showing you not just today’s performance, but predictable patterns that affect your long-term profitability.
With cohort analysis, you can finally answer critical questions like:
- Are customers who discovered you during your holiday promotion more or less valuable than those who found you through Instagram ads?
- How long does it typically take before a new customer makes their second purchase?
- Which customer groups are most likely to become loyal fans of your brand?
- Is your customer retention getting better or worse over time?
These insights go far beyond what traditional dashboards show you. But understanding the true value of different customer groups is just the beginning. How exactly does cohort analysis work for your Shopify store? Let’s see how you can put these powerful concepts into practice.
How Cohort Analysis Works for Shopify Stores
Before diving into fancy tools or complex spreadsheets, let’s understand the fundamental building blocks of cohort analysis for your Shopify business.
Think of cohort analysis as organizing your customers into meaningful yearbook classes, then watching how each class behaves as time goes on.
Cohort Grouping Strategies
There are two main ways to group your customers into cohorts:
- Time-based cohorts: This is the most common approach, where you group customers by when they first purchased from your store. For example, all customers who made their first purchase in January 2025 would form one cohort. This lets you compare how customers acquired in different time periods behave.
- Behavior-based cohorts: Here, you group customers based on what they did or how they found you. Examples include customers who purchased a specific product first, came from a particular marketing campaign, or used a certain discount code.
Data Requirements
To perform effective cohort analysis, you’ll need to track:
- Customer IDs (to identify unique customers)
- Purchase dates (first purchase date and all subsequent purchases)
- Order values (to calculate revenue metrics)
- Source information (how customers found your store, if possible)
The good news? If you’re using Shopify, most of this data is already being collected automatically.
Core Workflow
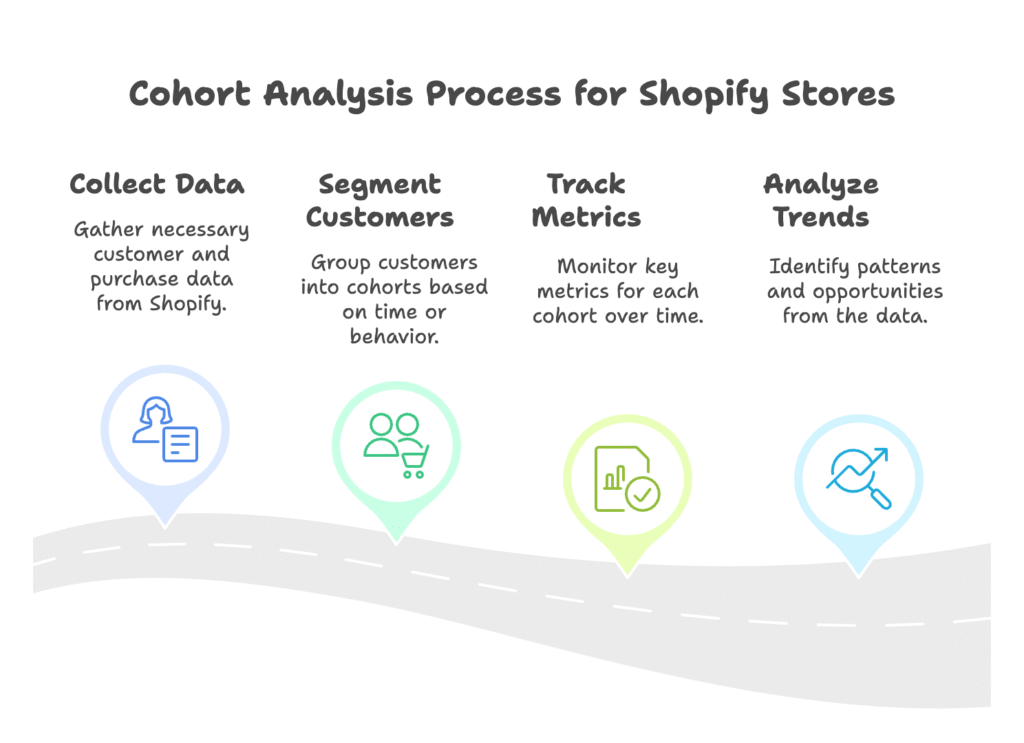
The basic process of cohort analysis follows four steps:
- Collect the data from your Shopify store and any other relevant sources
- Segment customers into cohorts based on your chosen criteria
- Track key metrics for each cohort over time (months, quarters, etc.)
- Analyze trends to identify patterns and opportunities
For example, you might track how many customers from your January cohort made a second purchase in February, March, April, and so on. Then compare this retention rate to your February cohort over similar time periods.
Now that you understand the basic framework, you’re probably wondering: “What exactly should I be measuring for each cohort?” Great question! Let’s explore the key metrics that will give you the most valuable insights about your customers’ behavior over time.
Key Metrics in Shopify Cohort Analysis
Not all numbers are created equal when it comes to understanding your customers. Let’s focus on the metrics that truly matter for cohort analysis in your Shopify store. These are the vital signs that reveal the health of your customer relationships over time.
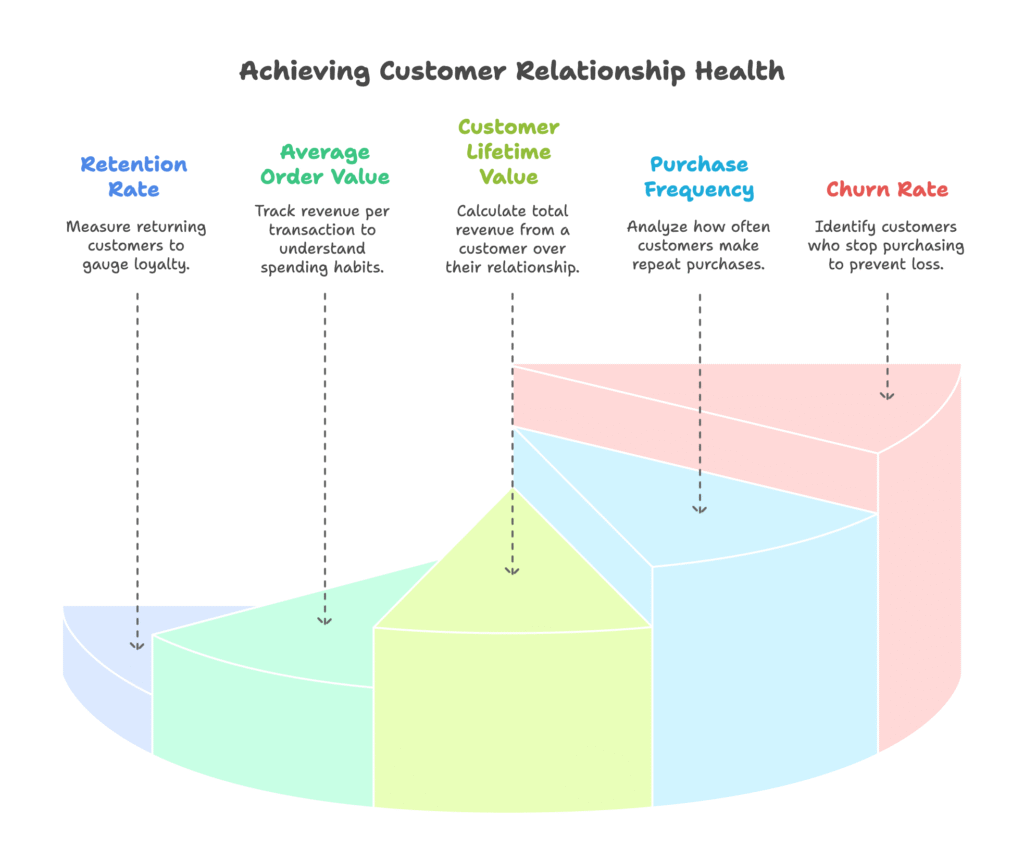
Retention Rate
This is perhaps the most important metric in cohort analysis – the percentage of customers who return to make additional purchases over time. For example, if 100 customers first purchased in January, and 20 of them came back to buy again in February, your month-1 retention rate for the January cohort would be 20%.
Tracking retention rates by cohort helps you identify:
- Whether your customer loyalty is improving or declining over time
- How quickly different customer groups tend to make repeat purchases
- Which acquisition channels bring in the most loyal customers
Average Order Value (AOV)
This measures how much revenue each transaction generates within a cohort. What makes cohort analysis special is seeing how AOV changes over time. Do your customers tend to spend more on their second or third purchase? Do customers from certain cohorts consistently spend more than others?
Customer Lifetime Value (LTV)
This represents the total revenue you can expect from a typical customer over their entire relationship with your brand. By calculating LTV for different cohorts, you can identify your most valuable customer segments and adjust your marketing spend accordingly.
A simple formula for calculating LTV is:
LTV = (Average Order Value) × (Purchase Frequency) × (Customer Lifespan)
Cohort analysis gives you the data to calculate this metric with much greater accuracy.
Purchase Frequency
How often do your customers come back to buy again? Some cohorts might purchase monthly, while others only return for seasonal purchases. Understanding these patterns helps you time your marketing efforts for maximum effectiveness.
Churn Rate
The flip side of retention is churn – the percentage of customers who stop purchasing from your store. In cohort analysis, you can identify when churn typically occurs and which customer groups are most likely to churn, giving you the opportunity to intervene at critical moments.
Now that you know what to measure, you’re probably eager to get started with your own cohort analysis. But how exactly do you extract and analyze all this data from your Shopify store? Let’s walk through a practical step-by-step guide next.
Step-by-Step Guide to Performing Cohort Analysis on Shopify
Ready to roll up your sleeves and dive into your customer data? Let’s break down exactly how to perform cohort analysis for your Shopify store, from the simplest approaches to more advanced methods.
Using Shopify’s Built-in Tools
Shopify offers some basic reporting capabilities that can get you started with simple cohort analysis:
- Go to your Shopify admin panel and navigate to Analytics > Reports
- Look for reports like “Sales by customer” or “Returning customer rate”
- Use filters to examine specific time periods
- For more detailed analysis, export your data by clicking on “Export” in the top right corner
While Shopify’s native reports don’t offer full cohort analysis capabilities, they provide the raw data you need to get started.
Third-Party Tools
Several Shopify apps can automate the cohort analysis process:
- RetentionX: Offers automated cohort tracking with visual dashboards
- By the Numbers: Specializes in LTV and CAC calculations for different customer segments
- Mipler: Provides pre-built templates for cohort reports
These apps can save you significant time and provide more sophisticated analysis than manual methods.
Manual Calculation Example
For those who prefer a hands-on approach, here’s a simple way to perform basic cohort analysis using spreadsheets:
- Export your order data from Shopify, including order dates, customer IDs, and order values
- Identify first purchase dates for each customer to assign them to cohorts
- Create a cohort table with cohorts in rows and time periods in columns
- Calculate retention rates by counting how many customers from each cohort made purchases in subsequent periods
Let’s look at a simple example. Imagine comparing a cohort of holiday shoppers (first purchase in December) with regular shoppers (first purchase in April). You might find that holiday shoppers have a higher initial AOV but lower retention rates, while April shoppers spend less initially but become more loyal over time.
This insight might lead you to create special retention campaigns targeting holiday shoppers, knowing they need extra nurturing to become repeat customers.
Understanding how to calculate these metrics is valuable, but the real magic happens when you put these insights into action. Let’s explore the concrete benefits cohort analysis can bring to your Shopify business.
Benefits of Cohort Analysis for Shopify Businesses
So far, we’ve covered the what and how of cohort analysis. But you might be wondering, “What’s the actual payoff?” Let’s explore the tangible benefits that make cohort analysis worth your time and effort.
Improving Customer Retention
One of the most powerful applications of cohort analysis is identifying exactly when and why customers tend to drop off. Maybe you discover that most customers churn after their third month, or that customers who purchase a specific product category rarely return.
With these insights, you can create targeted retention campaigns that intervene at critical moments. For example:
- Sending special offers to customers approaching their typical churn point
- Creating education content for products with high initial purchase but low repeat rates
- Developing loyalty programs designed around your actual customer lifecycle
Remember, increasing customer retention by just 5% can increase profits by 25-95%, according to research by Bain & Company.
Optimizing Marketing Spend
Not all customer acquisition channels are created equal. Cohort analysis helps you identify which sources bring in customers with the highest lifetime value, allowing you to allocate your marketing budget more effectively.
For instance, you might discover that while Facebook ads bring in more customers, those who come through Instagram have a 40% higher LTV. Armed with this knowledge, you can adjust your spending to focus on acquiring more of these high-value customers.
Product Insights
Cohort analysis can reveal fascinating connections between initial purchases and long-term customer behavior. You might find that customers who start with a particular product category become your most loyal fans, while others tend to be one-time shoppers.
These insights can inform:
- Which products to feature in new customer promotions
- How to structure product bundles to encourage valuable first purchases
- Which product lines might benefit from expanded offerings
Predictive Analytics
Once you’ve tracked cohorts over time, you can start to predict future behavior with remarkable accuracy. This allows you to forecast revenue more reliably and make more confident business decisions about inventory, staffing, and growth initiatives.
Now that we’ve covered the fundamental benefits, you might be wondering about more sophisticated applications of cohort analysis. Let’s explore some advanced techniques and real-world examples that can take your customer insights to the next level.
Advanced Applications and Case Studies
Ready to go beyond the basics? Let’s explore some more sophisticated applications of cohort analysis and see how real Shopify stores have used these insights to transform their businesses.
Seasonal Cohort Analysis
For many Shopify stores, customer behavior varies dramatically depending on the season when they first purchased. By comparing holiday cohorts with non-holiday cohorts, you can develop tailored strategies for each group.
For example, a craft supplies store discovered that customers acquired during the holiday season had a 30% lower retention rate than those acquired in spring. However, holiday cohorts spent 45% more on their initial purchase.
Their solution? They created a special “New Year Creative Challenge” email series specifically for their holiday cohorts, which successfully boosted their retention rate by 18% and turned many one-time gift buyers into hobby enthusiasts.
LTV:CAC Ratio Analysis
Advanced cohort analysis allows you to calculate a critical business metric: the ratio between Customer Lifetime Value (LTV) and Customer Acquisition Cost (CAC).
A healthy business typically aims for an LTV:CAC ratio of at least 3:1, meaning the lifetime value of a customer should be at least three times what it costs to acquire them. With cohort analysis, you can calculate this ratio for different customer segments and acquisition channels.
One Shopify apparel store found that their Google Ads customers had an LTV:CAC ratio of 2:1, while their Instagram customers were at 4:1. This insight led them to shift 40% of their Google Ads budget to Instagram, resulting in a 15% increase in overall profitability within three months.
Case Study Example
Let’s look at a real-world example of cohort analysis in action:
A Shopify beauty store noticed their overall retention rates were declining despite increased marketing efforts. Through cohort analysis, they discovered something interesting: customers were most likely to churn after their third month, regardless of when they first purchased.
Digging deeper, they found that most products lasted about 90 days before needing replacement. However, customers weren’t being reminded to restock at the right time.
Their solution was to implement a targeted email campaign specifically for customers approaching the three-month mark, featuring personalized reorder suggestions based on their previous purchases. The result? A 25% increase in retention for cohorts that received these timely reminders.
This kind of targeted intervention would have been impossible without the insights from cohort analysis.
Now that you’ve seen what’s possible, you’re probably eager to get started with your own advanced cohort analysis. But what tools can help you implement these strategies efficiently? Let’s explore the resources available to Shopify store owners.
Tools and Resources for Shopify Cohort Analysis
You don’t have to build your cohort analysis system from scratch. Let’s explore the tools and resources that can help you implement powerful cohort analysis for your Shopify store without becoming a data scientist overnight.
Shopify Apps
Several dedicated apps can streamline your cohort analysis process:
- RetentionX: Offers automated cohort tracking with visual dashboards that make it easy to spot trends. Particularly strong for retention analysis and customer segmentation.
- By the Numbers: Focuses on financial metrics like LTV and CAC calculations. Excellent for stores looking to optimize their marketing spend based on cohort performance.
- Mipler: Provides pre-built templates for cohort reports and makes it easy to share insights with team members. Great for stores that want regular, automated reporting.
These apps typically range from $20-100 per month, depending on your store size and the depth of analysis you need.
Spreadsheet Templates
If you prefer a more hands-on approach or are working with a limited budget, several spreadsheet templates can help you perform cohort analysis:
- Google Sheets offers several free cohort analysis templates in their template gallery
- Excel users can find cohort analysis templates in the Microsoft template store
- Many e-commerce blogs offer downloadable cohort analysis templates specifically designed for online stores
While spreadsheets require more manual work, they offer greater customization for stores with unique needs.
Educational Resources
To deepen your understanding of cohort analysis techniques:
- First Pier offers comprehensive guides on behavioral segmentation and cohort analysis specifically for Shopify stores
- Shopify’s own blog features articles on customer retention strategies and data analysis
- YouTube tutorials can walk you through the process of setting up cohort analysis in various tools
The tools are only as good as your understanding of how to use them effectively. Which brings us to an important topic: what pitfalls should you avoid when implementing cohort analysis? Let’s explore the common mistakes and how to navigate around them.
Common Pitfalls and How to Avoid Them
Even with the right tools, cohort analysis can go wrong if you’re not careful. Let’s examine some common mistakes Shopify store owners make and how you can avoid them.
Data Silos
One of the biggest challenges in cohort analysis is fragmented data. Many stores track customer behavior separately across different channels – your Shopify store, email platform, social media, and customer service system all contain valuable pieces of the puzzle.
How to avoid it: Work toward a unified customer view by:
- Using integration tools that connect your various platforms
- Implementing consistent customer identifiers across channels
- Considering customer data platforms (CDPs) for larger operations
Remember, a partial view of customer behavior can lead to misleading conclusions and ineffective strategies.
Short-Term Focus
Another common mistake is drawing conclusions too quickly from recent cohorts. Newer cohorts haven’t had enough time to reveal their true long-term behavior patterns, which can lead to premature judgments about their value.
How to avoid it:
- Always compare cohorts at equivalent points in their lifecycle
- Be patient with newer cohorts and avoid making major strategy changes based solely on their early performance
- Establish benchmarks based on historical cohort behavior
Ignoring Context
Numbers alone don’t tell the complete story. Many stores make the mistake of analyzing cohort data without considering the broader context – seasonal factors, market changes, or specific events that might influence behavior.
How to avoid it:
- Combine quantitative cohort data with qualitative insights from customer surveys or feedback
- Annotate your cohort analysis with significant events or changes (new product launches, marketing campaigns, etc.)
- Consider external factors like seasonality or market conditions when interpreting results
By avoiding these common pitfalls, you’ll be able to extract more accurate and actionable insights from your cohort analysis. But what does the future hold for this analytical approach? Let’s explore the emerging trends that could shape how Shopify stores use cohort analysis in the coming years.
Future Trends in Cohort Analysis
The world of e-commerce data analysis is evolving rapidly. Let’s look at some emerging trends that will likely shape the future of cohort analysis for Shopify stores.
AI-Driven Predictions
Artificial intelligence is transforming how we analyze customer data. For cohort analysis, AI can:
- Predict which new customers are likely to become high-value loyal customers based on their early behaviors
- Automatically identify the optimal timing for retention interventions
- Recommend personalized offers based on cohort behavior patterns
As these technologies become more accessible to small and medium-sized Shopify stores, they’ll enable much more sophisticated and proactive customer retention strategies.
Dynamic Cohorts
Traditional cohort analysis uses fixed groupings, but the future lies in dynamic cohorts that update in real-time based on customer interactions. This approach allows for:
- More fluid customer segmentation that reflects changing behaviors
- Real-time adjustments to marketing and retention strategies
- More personalized customer experiences based on behavioral signals
Dynamic cohorts give you a more current and accurate picture of your customer base, allowing for faster adaptation to changing patterns.
Integration with Omnichannel Data
As the boundaries between online and offline shopping continue to blur, cohort analysis will increasingly incorporate data from multiple channels:
- Connecting online Shopify purchases with in-store buying behavior
- Incorporating social media engagement as part of the customer journey
- Tracking how customers move between channels before making purchasing decisions
This holistic view will provide much richer insights into true customer lifetime value and the complex journeys customers take before and after their purchases.
By staying ahead of these trends, your Shopify store will be well-positioned to leverage the full power of cohort analysis as the technology continues to evolve.
Conclusion: Turning Insights into Action
We’ve covered a lot of ground in exploring how cohort analysis can transform your understanding of customer behavior on your Shopify store. From grouping customers meaningfully to tracking their evolution over time, these approaches reveal patterns that would otherwise remain hidden in your data.
Remember, the true value of cohort analysis isn’t in the charts and tables – it’s in the actions you take based on these insights:
- Identify your most valuable customer segments and double down on acquiring more like them
- Spot early warning signs of churn and intervene at the right moment
- Optimize your product offerings based on what drives long-term loyalty
- Allocate your marketing budget to channels that bring in customers with the highest lifetime value
Start small if you’re new to cohort analysis – perhaps by simply comparing retention rates across a few monthly cohorts. As you grow more comfortable with the process, you can incorporate more sophisticated metrics and analysis techniques.
Remember: Shopify store owners looking to accelerate their growth can leverage the powerful Growth Suite application, which includes built-in cohort analysis tools to help you understand and increase your customer lifetime value with just a few clicks.
The journey to truly understanding your customers is ongoing, but with cohort analysis as your guide, you’ll be making decisions based on data rather than hunches – and watching your customer lifetime value grow as a result.
References
- Shopify Customer Cohorts: A Comprehensive Guide – RetentionX
- Mastering Customer Cohort Analysis on Shopify – First Pier
- Cohort Analysis in Shopify: How to Track and Improve Customer … – Mipler
- The Shopify Cohort Analysis Guide to Retain Customers – By the Numbers
- Ultimate Shopify Cohort Analysis Guide for Beginners – First Pier