



Are you staring at your Shopify dashboard wondering if your store’s performance is any good? Does that 1.8% conversion rate deserve celebration or concern? If you’ve ever scratched your head looking at your conversion metrics, you’re not alone!
Here’s a little secret: improving your conversion rate by just 0.5% could mean thousands in additional revenue. That’s right—small improvements can lead to big profits when it comes to ecommerce conversion rates.
In this guide, you’ll learn:
- What conversion rates actually mean for your Shopify store
- Current industry benchmarks so you know where you stand
- Realistic goals to set based on your specific industry
- Proven strategies to boost your numbers
- How to turn better conversion rates into actual profit
Let’s dive in and transform those mysterious percentages into actionable insights that grow your business!
Understanding Conversion Rates in Shopify
Before we jump into the numbers, let’s get clear on what we’re actually measuring. Conversion rates might sound technical, but the concept is actually quite simple.
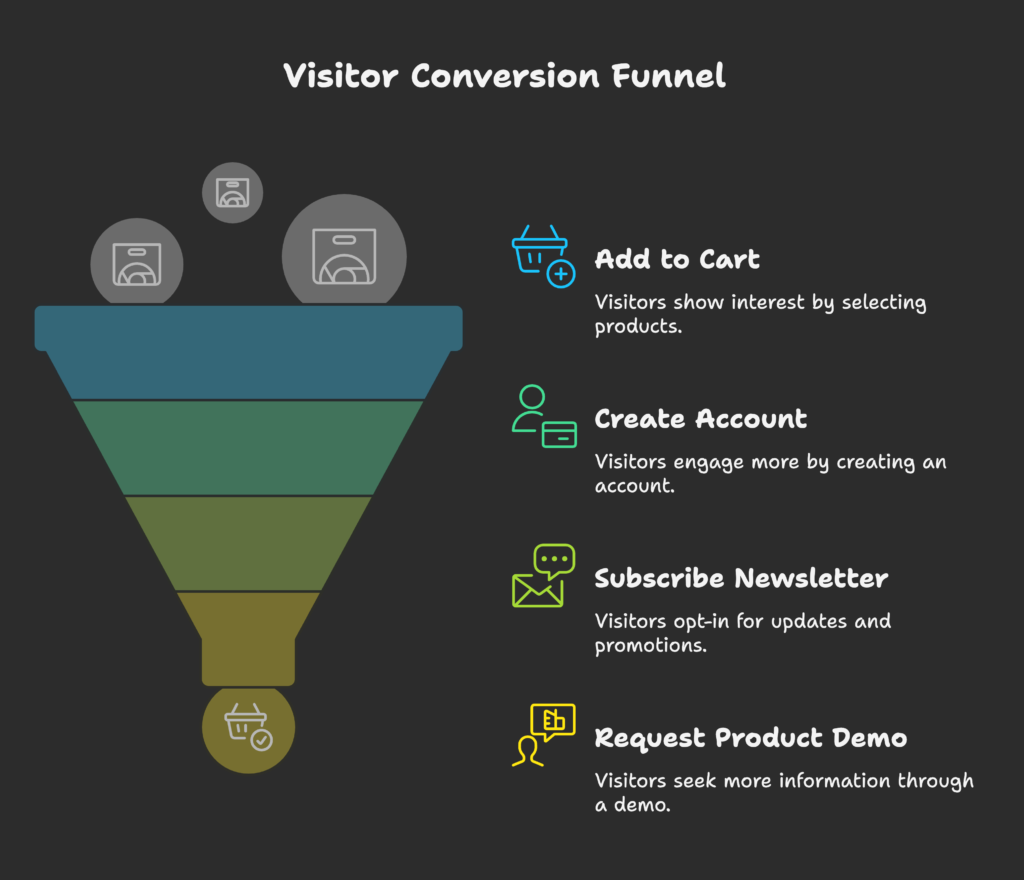
In the Shopify world, your conversion rate is the percentage of visitors who complete a desired action on your store. While purchases are the most common conversion, other valuable actions include:
- Adding products to cart
- Creating an account
- Subscribing to your newsletter
- Requesting a product demo
The basic formula is straightforward: (Number of conversions ÷ Total number of visitors) × 100 = Conversion rate percentage
For example, if your store had 5,000 visitors last month and 75 of them made a purchase, your conversion rate would be 1.5% (75 ÷ 5,000 × 100).
Shopify automatically calculates this for you in your analytics dashboard, making it easy to track changes over time. This little percentage packs a powerful punch—it tells you how effectively your store turns curious browsers into happy customers.
Why does this matter so much? Because unlike many other metrics, conversion rate cuts through the noise. You might have tons of traffic, but if they’re not buying, something needs fixing. Conversely, even a small store with the right conversion optimization can be wildly profitable.
Now that we understand what we’re measuring, let’s look at what’s considered “good” in today’s ecommerce landscape. The numbers might surprise you!
Current Shopify Conversion Rate Benchmarks
Wondering how your store stacks up against others? Let’s look at the current benchmarks for Shopify stores in 2025. These numbers give you a realistic picture of what’s happening across the platform.
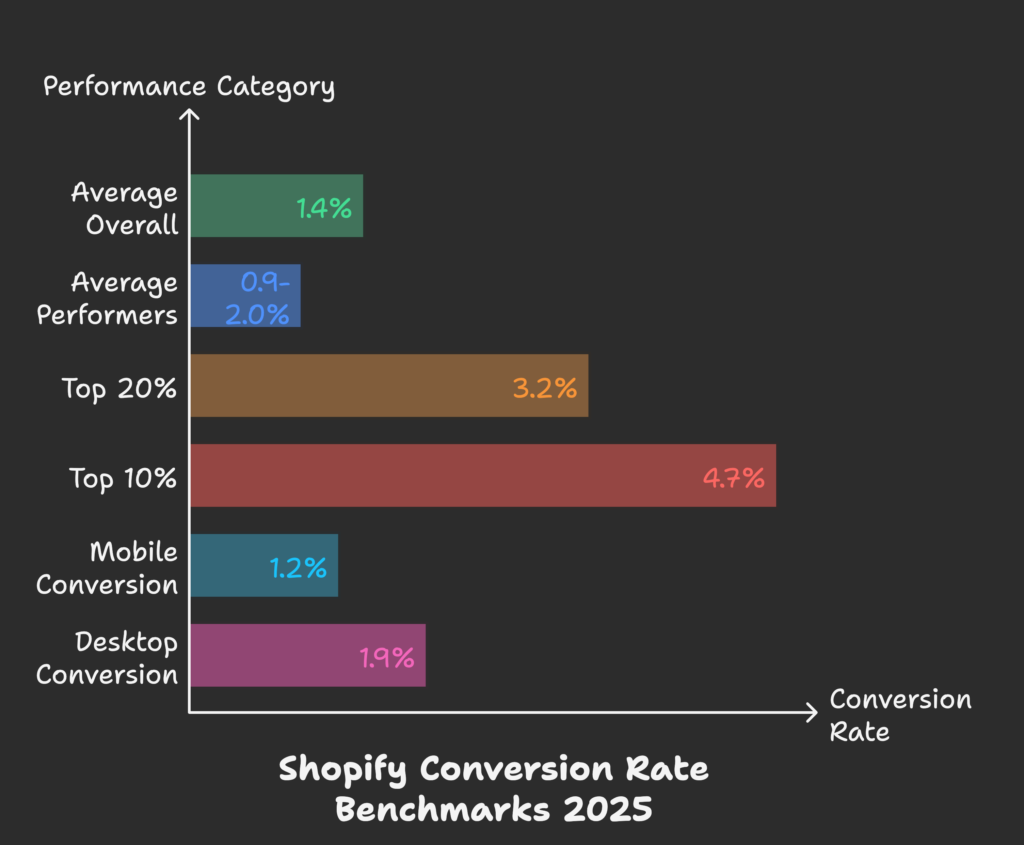
According to the latest data, the average overall conversion rate for Shopify stores is 1.4% across all industries. But averages only tell part of the story.
Here’s a more detailed breakdown:
- Average performers (middle 50%): 0.9% – 2.0%
- Top 20% of stores: 3.2% and above
- Top 10% of performers: 4.7% and above
Device type also plays a significant role:
- Mobile conversion: 1.2% average
- Desktop conversion: 1.9% average
Historically, these numbers have been slowly improving. Five years ago, the average Shopify conversion rate hovered around 1.2%, showing how the platform and its merchants have gotten better at converting visitors.
Compared to other ecommerce platforms, Shopify stores typically perform slightly better than the industry average of 1.3%, likely due to Shopify’s focus on user experience and conversion-friendly templates.
But these overall numbers only scratch the surface. What really matters is how your store compares to others in your specific industry. After all, someone buying a $5 pair of socks makes decisions very differently than someone considering a $2,000 furniture purchase. Let’s break down those industry-specific numbers next!
Industry-Specific Conversion Rate Benchmarks
Not all products are created equal when it comes to conversion rates. Your industry significantly impacts what you should expect and aim for. Let’s look at how different sectors perform on Shopify in 2025.
| Industry | Average Rate | Top 20% Rate | Top 10% Rate |
|---|---|---|---|
| Food & Beverage | 1.5% | 4.1% | 6.2% |
| Style & Fashion | 1.9% | 4.3% | 6.1% |
| Travel | 0.2% | 2.0% | 3.4% |
| Finance | 0.2% | 2.2% | 3.2% |
| Health & Beauty | 2.2% | 4.9% | 7.1% |
| Home & Garden | 1.7% | 3.8% | 5.5% |
| Electronics | 1.0% | 2.9% | 4.3% |
These numbers reveal some interesting patterns:
- Impulse purchase categories like Health & Beauty and Food & Beverage tend to convert at higher rates
- High consideration industries like Travel and Finance naturally have lower conversion rates due to longer decision-making processes
- Style & Fashion performs better than average despite being competitive, likely due to strong visual appeal and social proof elements
What’s most striking is the gap between average performers and top performers in each category. This suggests that regardless of industry, there’s significant room for improvement for most stores.
Now you have a clearer picture of what’s realistic for your specific industry. But what factors actually move the needle on these numbers? Let’s explore what makes some stores convert better than others, regardless of what they’re selling!
Factors Affecting Shopify Conversion Rates
Now that you know the benchmarks, let’s look at what actually influences your conversion rates. Understanding these factors puts you in control of improving your numbers.
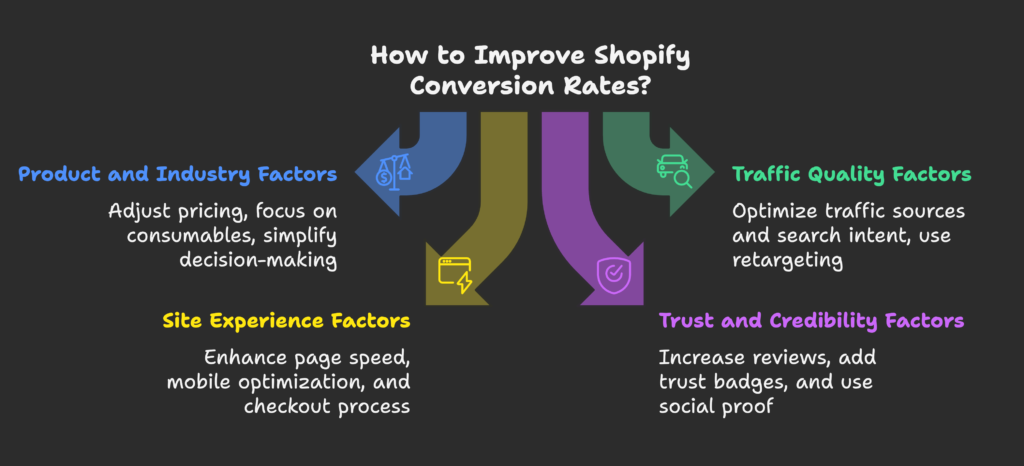
Product and Industry Factors
- Price point – Higher-priced items typically convert at lower rates (0.2-0.8% for luxury goods vs 3-5% for affordable items)
- Purchase frequency – Consumable products tend to convert better than one-time purchases
- Decision complexity – Products requiring research convert at 40-60% lower rates
Traffic Quality Factors
- Traffic source – Email traffic typically converts 2-3× better than social media traffic
- Search intent – Branded search traffic converts up to 5× better than generic terms
- Retargeting – Retargeted visitors convert at 2-3× the rate of first-time visitors
Site Experience Factors
- Page load speed – Every additional second of load time reduces conversion by approximately 7%
- Mobile optimization – Properly optimized mobile sites convert up to 2× better than poorly optimized ones
- Checkout steps – Each additional checkout step reduces conversion by 10-15%
Trust and Credibility Factors
- Reviews and ratings – Products with 50+ reviews convert 4.6% better than those with none
- Trust badges – Security and payment badges can increase conversion by 40%+
- Social proof – “People who bought this also bought…” features increase conversion by 10-30%
Seasonal and Temporal Factors
- Holiday season – November-December typically sees 25-35% higher conversion rates
- Day of week – Weekends often convert 15% lower than weekdays for B2B products, but 20% higher for B2C
- Time of day – Evening hours (7-10 PM local time) often convert best
The great news? Many of these factors are completely within your control. While you can’t change your industry, you can certainly improve your site speed, add social proof, and optimize your checkout process.
Now that you understand what affects your conversion rate, how do you set goals that are ambitious yet achievable? Let’s look at goal-setting strategies that can transform your store’s performance!
Setting Realistic Conversion Rate Goals
Having benchmarks is great, but how do you translate these industry numbers into specific goals for your store? Let’s create a practical framework for setting conversion targets that push you forward without being unrealistic.
Step 1: Establish Your Baseline
Before setting goals, you need to know exactly where you stand:
- Review your last 3-6 months of conversion data
- Calculate your average conversion rate
- Note any seasonal variations or outliers
- Break down by traffic source, device type, and product category
Step 2: Choose the Right Target Based on Store Maturity
For new stores (under 1 year):
- First 3 months: Focus on reaching 50% of your industry average
- Months 4-6: Aim for 75% of industry average
- Months 7-12: Work toward meeting industry average
For established stores (1-3 years):
- If below industry average: Aim to meet industry average within 6 months
- If at industry average: Target top 20% metrics within 12 months
- If above industry average: Focus on incremental 10-15% improvements every quarter
For mature stores (3+ years):
- Target specific underperforming segments rather than overall conversion
- Set micro-conversion goals for specific funnel stages
- Benchmark against top 10% in your industry
Step 3: Balance Conversion Goals With Other Metrics
Remember that conversion rate isn’t the only metric that matters. Sometimes, it makes sense to focus elsewhere:
- When to prioritize conversion rate: When traffic is expensive or you’ve hit a traffic plateau
- When to prioritize average order value (AOV): When conversion is already strong but order values are low
- When to focus on customer lifetime value (CLV): When selling subscription or replenishable products
A balanced approach might mean accepting a slightly lower conversion rate if it means attracting higher-value customers or building a more loyal customer base.
Setting the right goals is just the first step. The real question is: what’s the actual business impact of improving your conversion rate? Let’s explore how even small improvements translate into real dollars!
Calculating the Financial Impact of Conversion Improvements
Numbers are nice, but money talks. Let’s translate those percentage improvements into actual revenue so you can see exactly why conversion rate optimization is worth your time and investment.
The Multiplication Effect
Here’s a simple formula to calculate the impact of conversion improvements:
Monthly visitors × Conversion rate × Average order value = Monthly revenue
Let’s look at a practical example:
| Scenario | Monthly Visitors | Conversion Rate | Average Order | Monthly Revenue | Annual Impact |
|---|---|---|---|---|---|
| Current State | 10,000 | 1.4% | $80 | $11,200 | $134,400 |
| After 0.5% Increase | 10,000 | 1.9% | $80 | $15,200 | $182,400 |
| Difference | 0 | +0.5% | $0 | +$4,000 | +$48,000 |
That’s right—a mere 0.5% improvement in conversion rate (from 1.4% to 1.9%) creates an additional $48,000 in annual revenue without a single new visitor!
Conversion vs. Traffic Acquisition ROI
Let’s compare the ROI of improving conversion versus acquiring more traffic:
- Option 1: Increase traffic by 35% to achieve the same revenue boost
- At an average cost per click of $1.20, you’d spend $4,200 monthly ($50,400 annually) on ads
- Net profit impact: Negative $2,400
- Option 2: Improve conversion rate by 0.5%
- Typical CRO program cost: $1,000-$3,000 monthly ($12,000-$36,000 annually)
- Net profit impact: Positive $12,000-$36,000
The difference is clear: conversion optimization often delivers better ROI than acquiring more traffic, especially for established stores.
Building Your Business Case
When planning your conversion optimization budget, consider these factors:
- Current traffic value (monthly visitors × conversion rate × average order)
- Projected improvement (aim for 20-30% increase in year one)
- Implementation costs (tools, developers, designers)
- Opportunity cost of focusing resources elsewhere
For most Shopify stores, allocating 5-10% of your digital marketing budget to conversion rate optimization offers the best balance.
Now that you understand the financial impact, let’s explore how conversion rate connects to other key performance indicators in your business.
Key Metrics Related to Conversion Rates
Conversion rate doesn’t exist in isolation. Understanding how it relates to other metrics gives you a more complete picture of your store’s health and where to focus your improvement efforts.
Average Order Value (AOV)
Relationship with conversion rate: Often inverse. Higher AOV typically means lower conversion rate.
- Low AOV + Low conversion = Fundamental value proposition issues
- Low AOV + High conversion = Great for consumables/repeat purchase products
- High AOV + Low conversion = Normal for premium products (focus on improving conversion)
- High AOV + High conversion = Ideal state (focus on scaling traffic)
Cart Abandonment Rate
Relationship with conversion rate: Direct. Average cart abandonment rate is 69.8% across Shopify.
- Each 5% reduction in cart abandonment can lift overall conversion by 0.2-0.4%
- Cart abandonment emails recover approximately 10% of abandoned carts
Customer Acquisition Cost (CAC)
Relationship with conversion rate: Inverse. Higher conversion rates reduce your effective CAC.
- Formula: Marketing Spend ÷ (Visitors × Conversion Rate) = Cost Per Acquisition
- Industry average: CAC should be recovered within 3 months for sustainable growth
Return Customer Rate
Relationship with conversion rate: Complementary. Return customers convert 3-5× better than new visitors.
- Industry average: 20-30% of customers should make a repeat purchase
- Each 5% increase in return customer rate improves overall conversion by 0.1-0.3%
Click-Through Rates (CTR)
Relationship with conversion rate: Micro-conversion indicator. Category page to product page CTR averages 8-12%.
- Product page to add-to-cart CTR averages 5-8%
- Low CTR + Average conversion = Traffic quality issue
- High CTR + Low conversion = Product page or checkout issue
Net Promoter Score (NPS)
Relationship with conversion rate: Leading indicator. NPS above 50 correlates with above-average conversion.
- Stores with NPS over 70 typically see conversion rates 40% above industry average
- NPS improvements often precede conversion improvements by 2-3 months
By tracking these related metrics alongside your conversion rate, you’ll gain a deeper understanding of your store’s performance and be able to diagnose issues more accurately.
Now that we understand the metrics, let’s dive into specific strategies to improve your conversion rate!
Conversion Rate Optimization Strategies for Shopify
It’s time to get practical. Let’s explore proven tactics to boost your conversion rate, organized by where they fit in your customer journey.
Product Page Optimization
Since 70-80% of purchase decisions happen on product pages, start here:
- High-quality images: Include 5-8 images per product, showing different angles and usage contexts
- Video content: Products with videos convert 80% better than those without
- Detailed descriptions: Answer the top 5-7 customer questions directly in your copy
- Simplified variants: Limit options to 3-4 choices per attribute (size, color, etc.)
- Clear pricing: Make total costs (including shipping) visible before checkout
Checkout Process Streamlining
The checkout is where 70% of abandonment happens:
- One-page checkout: Converts 55% better than multi-page processes
- Guest checkout option: Increases conversion by 30% for first-time buyers
- Multiple payment options: Offering 3+ payment methods lifts conversion by 30%
- Progress indicators: Show customers exactly where they are in the process
- Automatic error detection: Flag form errors instantly, not after submission
Mobile Experience Enhancement
With 67% of Shopify traffic coming from mobile:
- Thumb-friendly design: Keep key elements in the center 60% of the screen
- Simplified navigation: Limit menu items to 5-7 main categories
- Large, clear CTAs: Make buttons at least 44×44 pixels
- Sticky add-to-cart: Keep the purchase button visible while scrolling
- Form autofill: Enable browser autofill for faster checkout
Trust Building Tactics
Trust concerns influence 92% of purchase decisions:
- Product reviews: Display review count prominently (aim for 20+ per product)
- Security badges: Display payment and security logos at checkout
- Clear shipping/returns: Make policies visible before checkout begins
- Social proof: Show “X people purchased this month” when possible
- Live chat: Offering real-time support lifts conversion by 20%
A/B Testing Framework
Systematic testing is key to sustainable improvement:
- Start with high-traffic pages (home, top products)
- Test one element at a time (headlines, images, CTAs, pricing presentation)
- Run tests for at least 1-2 weeks or 100 conversions per variation
- Document all tests, even unsuccessful ones
- Implement winners and build on insights for future tests
The best strategy combines these elements into a systematic approach rather than making random changes. Start with the areas where data shows the biggest drop-offs in your funnel.
But to implement these strategies effectively, you’ll need the right tools. Let’s look at what should be in your conversion optimization toolkit!
Technical Tools for Measuring and Improving Conversion
Having the right tools makes conversion optimization much easier. Here’s a practical toolkit for Shopify store owners in 2025.
Analytics Platforms
- Shopify Analytics: Built-in basics for conversion tracking by product, collection, and traffic source
- Limitation: Less granular than dedicated analytics tools
- Best for: Quick overview and basic trend analysis
- Google Analytics 4: Free, powerful tool for deeper analysis
- Setup tip: Create conversion funnels to track drop-off points
- Key feature: Custom segments to analyze different visitor types
- Triple Whale: Ecommerce-specific analytics platform
- Strength: Attribution modeling across channels
- Cost: $99-$299/month based on revenue
Behavior Analysis Tools
- Hotjar: Heatmaps and session recordings
- Key insight: See exactly where visitors click, hover, and scroll
- Implementation: Focus on top landing pages and checkout process
- Lucky Orange: Visitor recording with form analytics
- Unique feature: Form field abandonment analysis
- Cost: $49-$149/month based on traffic
A/B Testing Platforms
- Shopify Native A/B Testing: Available on Plus plan
- Best for: Simple headline and image tests
- Limitation: Can’t test checkout changes
- Intellimize: AI-powered testing platform
- Advantage: Multi-variable testing even with lower traffic
- Cost: Starts at $2,000/month (enterprise-focused)
- Convert: Mid-market testing solution
- Feature: Visual editor requires no coding
- Cost: $699-$999/month
Customer Feedback Tools
- Gorgias: Customer service platform with feedback capabilities
- Integration: Combines support and conversion optimization
- Insight: Track reasons for abandoned purchases
- Yotpo: Reviews and UGC platform
- Conversion boost: 161% higher conversion rate for products with reviews
- Feature: AI-powered review displays that show most relevant reviews first
Cart Recovery Solutions
- Klaviyo: Email marketing with abandoned cart automation
- Recovery rate: Average 10-15% of abandoned carts
- Best practice: Three-email sequence (1hr, 24hr, 48hr)
- PushOwl: Browser notification for cart abandonment
- Advantage: Captures visitors without email
- Conversion rate: 1.5-4% recovery on notifications
Personalization Engines
- Dynamic Yield: Enterprise-level personalization
- Feature: Real-time personalization based on behavior
- Results: Average 15-25% conversion lift
- Nosto: Mid-market personalization solution
- Key advantage: Product recommendations that convert 2-3× better
- Cost: $199/month and up based on revenue
Start with the essentials: Shopify Analytics + Google Analytics 4 + one behavior analysis tool. This combination gives you 80% of the insights with 20% of the investment.
Let’s see how real businesses have put these tools and strategies into action with some inspiring case studies!
Case Studies: Conversion Rate Success Stories
Theory is helpful, but nothing beats seeing real results. Let’s explore how several Shopify merchants have transformed their conversion rates and what we can learn from them.
Small Business Transformation: Bella’s Bakery Box
Initial situation:
- Monthly visitors: 18,000
- Starting conversion rate: 0.9% (below Food & Beverage average)
- Monthly revenue: $14,580
Key changes implemented:
- Added product videos showing unboxing experience
- Implemented one-page checkout
- Added SMS review collection (increased reviews by 320%)
- Created urgency with limited batch production messaging
Results after 90 days:
- New conversion rate: 2.3% (155% increase)
- New monthly revenue: $37,260 (156% increase)
- No increase in marketing spend
Key takeaway: For small businesses, focusing on visual content and checkout simplification offers the fastest ROI.
Mobile Optimization Win: UrbanGear Apparel
Initial situation:
- Mobile traffic: 78% of total
- Mobile conversion: 0.8% (desktop at 2.1%)
- Mobile revenue: 62% of total despite higher traffic
Key changes implemented:
- Reduced image sizes (improved load time by 2.3 seconds)
- Implemented sticky add-to-cart buttons
- Created mobile-specific product page layout
- Added Apple Pay and Google Pay options
- Simplified navigation for thumb-friendly use
Results after 60 days:
- New mobile conversion: 1.7% (113% increase)
- Mobile revenue share: 81% of total
- Overall store conversion: 1.9% (from 1.2%)
Key takeaway: Mobile optimization should be your priority if most of your traffic comes from mobile devices.
Seasonal Campaign Success: OutdoorLife Equipment
Initial situation:
- Previous year’s Black Friday conversion: 1.8%
- Industry average for outdoor equipment during BFCM: 2.5%
- High cart abandonment (76%)
Key changes implemented:
- Pre-Black Friday email campaign with early access
- Created scarcity with inventory counters
- Simplified checkout process from 3 pages to 1
- Implemented exit-intent popups with discount codes
- Added 3-part abandoned cart email sequence
Black Friday results:
- New conversion rate: 3.7% (106% increase year-over-year)
- Cart abandonment reduced to 58%
- Revenue increased 143% year-over-year despite only 18% traffic increase
Key takeaway: Seasonal campaigns should focus on both conversion optimization and cart recovery for maximum impact.
These case studies highlight an important truth: significant conversion improvements are possible regardless of your store size, industry, or current performance. The key is identifying your specific conversion obstacles and addressing them systematically.
Speaking of obstacles, let’s look at the most common conversion roadblocks and how to overcome them!
Common Conversion Obstacles and Solutions
Every Shopify store faces conversion challenges, but the good news is most have been solved by others before you. Let’s look at the most common roadblocks and their proven solutions.
Shopping Cart Abandonment Issues
The problem: 69.8% average cart abandonment rate across Shopify stores.
Top reasons for abandonment:
- Unexpected shipping costs (48% of abandonments)
- Forced account creation (24%)
- Complicated checkout process (18%)
- Inability to calculate total costs upfront (16%)
- Website errors/crashes (13%)
Solutions:
- Show shipping costs on product pages or offer free shipping
- Make guest checkout the default option
- Implement one-page checkout
- Add order summary that stays visible throughout checkout
- Set up cart abandonment email sequences (1hr, 24hr, 48hr)
Trust Barriers
The problem: 92% of consumers have hesitations about purchasing from unfamiliar stores.
Common trust issues:
- Insufficient product information (61%)
- Unclear return policy (53%)
- Few or no reviews (47%)
- Unprofessional design (42%)
- Missing contact information (38%)
Solutions:
- Include detailed product specifications and size guides
- Make return/exchange policy visible on product pages
- Implement review collection campaigns (email, SMS)
- Display trust badges and payment logos
- Add clear contact information in footer and about page
Mobile Conversion Challenges
The problem: Mobile conversion rates average 37% lower than desktop despite making up majority of traffic.
Common mobile issues:
- Slow page load (57% abandon if loads take >3 seconds)
- Difficult form completion (53%)
- Poor tap target size (47%)
- Text too small to read (42%)
- Horizontal scrolling required (39%)
Solutions:
- Optimize image sizes specifically for mobile
- Use browser autofill for forms
- Make all buttons at least 44×44 pixels
- Set minimum font size to 16px
- Test on multiple devices and screen sizes
Navigation and Search Frustrations
The problem: 38% of visitors leave without purchasing if they can’t find what they want quickly.
Common navigation issues:
- Poor search functionality (68%)
- Confusing category structure (53%)
- Too many menu options (47%)
- Inconsistent filtering options (42%)
- Lack of related product suggestions (38%)
Solutions:
- Implement predictive search with product thumbnails
- Limit main navigation to 5-7 categories
- Add consistent filtering options across all collections
- Show recently viewed items
- Include “customers also bought” recommendations
Payment and Checkout Friction
The problem: 7% of US online purchases are abandoned due to limited payment options.
Common payment issues:
- Limited payment methods (58%)
- Security concerns (52%)
- Credit card entry errors (43%)
- Address validation problems (38%)
- Lack of financing options for larger purchases (32%)
Solutions:
- Offer 4+ payment methods including digital wallets
- Display security badges near payment information
- Implement address autocomplete
- Add “buy now, pay later” options for purchases over $50
- Save payment information for returning customers
The most effective approach is to identify which of these obstacles are most relevant to your store. Review your analytics to find the pages with highest exit rates and focus your efforts there first.
Now that we’ve covered the obstacles, let’s look at how to create a systematic program for ongoing conversion improvement!
Setting Up a Structured Conversion Optimization Program
Random tactics might give you occasional wins, but systematic improvement requires a structured approach. Here’s how to build a conversion optimization program that delivers consistent results over time.
Step 1: Establish Your Conversion Team
Even if you’re a solo entrepreneur, define who handles what:
- For small stores (under $500K/year):
- Owner/operator: Strategy and analysis
- Part-time designer: Implementation
- VA or customer service: Feedback collection
- For growing stores ($500K-$2M/year):
- Marketing manager: Oversee program
- Designer/developer: Implementation
- Customer service: Feedback collection
- Data analyst (part-time): Insights and reporting
- For established stores ($2M+/year):
- Dedicated CRO specialist
- UX designer
- Developer for implementation
- Data analyst
- Customer research specialist
Step 2: Create a Testing Roadmap
Prioritize your efforts with the PIE framework:
- Potential: How much improvement can this change create?
- Importance: How valuable is the page or element to conversions?
- Ease: How difficult is it to implement and test?
Sample 90-day roadmap:
- Weeks 1-2: Analyze data and identify top 3 opportunities
- Weeks 3-4: Test homepage hero section
- Weeks 5-6: Test product page layout/content
- Weeks 7-8: Test checkout flow improvements
- Weeks 9-10: Test cart abandonment recovery
- Weeks 11-12: Review results and plan next quarter
Step 3: Implement Data Collection Systems
You need both quantitative and qualitative data:
- Quantitative tools:
- Google Analytics 4 (user flow, conversion funnels)
- Heatmaps/session recordings
- A/B testing platform
- Qualitative methods:
- Post-purchase surveys (Net Promoter Score)
- Exit-intent surveys (why are you leaving?)
- Customer service feedback analysis
- User testing (5-10 users per quarter)
Step 4: Follow a Structured Testing Process
For each optimization initiative:
- Observe: Review data to identify issues
- Hypothesize: “We believe that [change] will result in [outcome] because [rationale].”
- Prioritize: Use PIE framework to rank opportunities
- Test: Implement A/B test (run for minimum 1-2 weeks)
- Analyze: Review results for statistical significance
- Implement: Roll out winners to all users
- Document: Record learnings in a test library
Step 5: Create Reporting and Success Metrics
Track and report on these key metrics monthly:
- Overall conversion rate (vs. previous period and YoY)
- Device-specific conversion rates
- Top landing page conversion rates
- Funnel step conversion rates
- Tests conducted and their impact
- Revenue lift attributed to CRO program
Step 6: Develop a Continuous Improvement Cycle
Sustainable conversion improvement requires:
- Quarterly strategy reviews
- Regular competitor analysis
- Customer journey remapping every 6 months
- Annual technology assessment
- Testing program expansion as you grow
With this structured approach, you’ll avoid the common trap of random tactical changes and build a system that delivers compound growth over time.
Speaking of the future, let’s look at what’s coming next in the world of conversion optimization!
Future Trends in Shopify Conversion Optimization
The ecommerce landscape is constantly evolving. Let’s explore the emerging trends that will shape Shopify conversion optimization in the coming years so you can stay ahead of the curve.
AI and Machine Learning Applications
Artificial intelligence is transforming conversion optimization:
- Predictive personalization: AI will analyze browsing patterns to show optimal product recommendations in real-time
- Dynamic pricing: Price optimization based on user behavior, inventory levels, and competitive data
- Intelligent search: Natural language processing that understands intent rather than just keywords
- Automated testing: AI systems that generate and test variations without human intervention
- Conversion prediction: Identifying high-intent visitors for targeted interventions
Expected impact: 15-25% conversion lift for early adopters by late 2025.
Advanced Personalization
Personalization is evolving beyond basic product recommendations:
- Individual user journeys: Custom paths based on predicted intent
- Contextual personalization: Adapting to weather, location, time, and device
- Emotional targeting: Adjusting messaging based on detected user sentiment
- Cross-device personalization: Unified experience as users switch between devices
- Zero-party data utilization: Leveraging explicitly shared preferences
Expected impact: Personalized experiences will deliver 40% higher conversion rates than generic ones by 2026.
Voice Commerce and Conversational Interfaces
Voice and chat are becoming important commerce channels:
- Voice search optimization: Adapting product content for voice queries
- Conversational commerce: Shopping through chat interfaces and AI assistants
- Voice-activated checkout: Simplifying purchases with voice commands
- Multimodal interactions: Combining voice, text, and visual inputs
- Voice-optimized navigation: Browsing catalogs through conversational flows
Expected impact: 30% of searches will be screenless by 2026, requiring voice-optimized content.
Augmented Reality Shopping
AR is removing purchase uncertainty:
- Virtual try-on: Testing products virtually before purchase
- In-home visualization: Seeing how furniture and decor fit in your space
- Interactive product exploration: Examining products from all angles
- Size and fit visualization: Reducing returns through accurate sizing
- AR-powered customization: Visualizing custom products before ordering
Expected impact: Products with AR experiences convert 94% better than those without.
Mobile Commerce Evolution
Mobile shopping is becoming increasingly sophisticated:
- App-like experiences: Progressive Web Apps that work offline
- Super apps: All-in-one platforms combining shopping, payments, and communication
- Mobile-first checkout: Built specifically for thumb navigation
- Mobile wallet integration: Seamless payment with stored information
- Location-based offerings: Deals based on proximity to physical locations
Expected impact: Mobile commerce will account for 73% of ecommerce sales by 2026.
Privacy Changes and First-Party Data
The cookie-less future is changing optimization strategies:
- First-party data strategies: Building direct relationships with customers
- Zero-party data collection: Explicitly asking for preferences
- Privacy-preserving analytics: Measurement without personal identifiers
- Consent-based personalization: Clear value exchanges for data sharing
- Server-side tracking: Gathering data without client-side cookies
Expected impact: Brands with strong first-party data strategies will outperform peers by 30% in conversion rates.
To prepare for these trends, focus on building your first-party data assets, investing in modular technology that can adapt to new channels, and experimenting with emerging technologies like AR and voice on a small scale before full implementation.
Now that we’ve explored current best practices and future trends, let’s wrap up with actionable next steps to improve your conversion rate.
Conclusion
We’ve covered a lot of ground in this guide to Shopify conversion rate benchmarks and optimization. Let’s recap the key points and outline your next steps for improvement.
Key Benchmarks to Remember
- Overall Shopify average: 1.4% conversion rate
- Top 20% performers: 3.2% and above
- Mobile benchmarks: 1.2% average (vs. 1.9% for desktop)
- Industry variations: From 0.2% (travel, finance) to 2.2% (health & beauty)
Remember that these benchmarks provide context, but your own historical data and growth trajectory are often more important than industry comparisons.
Your Conversion Optimization Action Plan
Here’s a simple 30-60-90 day plan to get started:
First 30 days: Analyze and fix the basics
- Implement Google Analytics 4 and set up conversion tracking
- Add a heatmap/session recording tool to key pages
- Ensure mobile responsiveness across all pages
- Set up abandoned cart recovery emails
- Fix any obvious checkout friction points
Days 31-60: Optimize critical conversion pages
- Enhance product pages with better images, videos, and descriptions
- Add social proof elements (reviews, testimonials)
- Simplify your navigation structure
- Improve site speed (aim for <2 second load times)
- Test different CTAs and button designs
Days 61-90: Implement advanced strategies
- Start a systematic A/B testing program
- Implement personalization based on visitor behavior
- Optimize for specific traffic sources
- Enhance post-purchase experience to drive reviews and repeat purchases
- Develop a customer feedback loop for continuous improvement
Balancing Conversion with Other Priorities
While conversion rate is critical, remember to balance it with:
- Average order value (sometimes lower conversion for higher AOV is worth it)
- Customer acquisition costs (higher-quality traffic might convert better but cost more)
- Customer lifetime value (focusing on loyal customers vs. one-time buyers)
- Brand perception (avoid conversion tactics that damage trust)
The most successful Shopify stores view conversion optimization not as a one-time project but as an ongoing program of continuous improvement. Every small gain compounds over time to create significant results.
Remember: Looking to boost your Shopify store’s sales even further? The Growth Suite app for Shopify helps merchants increase their conversion rates through smart product recommendations, personalized discounts, and optimized checkout experiences. It’s the perfect companion to the strategies outlined in this guide!
References
- LittleData. (2023, January 1). Average Ecommerce Conversion Rate – Littledata
- Varos. (2023, April 26). Shopify Conversion Rate: Conversion Rate by Industry – Varos
- PageFly. (2025, March 12). Shopify Conversion Rate: Average, How to Calculate and Optimize
- FastBundle. (2025, March 1). What is a good conversion rate on shopify In 2025? + 10 Ways To Improve
- Shogun. (2024, July 3). Mastering the Art of Shopify Conversion Rate Optimization
- Reddit. (2021). What is your conversion rate? r/shopify
- Uptek. (2025, January 29). Shopify Conversion Rate Statistics 2025: A Full Breakdown
- Shopify. (2024, November 8). What’s a Good Average Ecommerce Conversion Rate in 2025?
- Popupsmart. (2024, December 23). Shopify Conversion Rate Statistics You Need To Know in 2025
- Product Customizer. (2023, September 8). Shopify Conversion Rate: Benchmarks & Increasing Conversions